LightCat is an open-source password manager software that allows users to securely store passwords and other sensitive information. It has a clean, intuitive interface, utilizes strong encryption to protect data, and has features like auto-fill forms and password generation.
LightCat is an open-source password manager software that allows users to securely store passwords and other sensitive information. It has a clean, intuitive interface, utilizes strong encryption to protect data, and has features like auto-fill forms and password generation.
What is LightCat?
LightCat is an emerging open-source password manager that allows users to securely store website logins, credit card numbers, identities, and other sensitive information behind one master password. It utilizes strong AES-256 bit encryption to protect user data and ensures information is accessible only to the owner.
Some key features of LightCat include:
Clean, intuitive interface for easily storing, organizing, and accessing sensitive data
Secure password generator to create strong, random account passwords
Auto-fill login credentials into online forms and shopping checkouts
Cross-platform sync to access info across devices with end-to-end encryption
Open source code that allows transparency and community contributions
With its focus on usability, security, and privacy, LightCat aims to provide an excellent free alternative to proprietary competitors for individuals seeking a safe place to store confidential information. Its lack of reliance on the cloud for sync makes it uniquely positioned for users wanting enhanced control over their sensitive data.
LightCat Features
Features
Open-source password manager
Securely stores passwords and sensitive information
Tableau is a leading business intelligence and data visualization platform used by organizations of all sizes to transform their data into easy-to-understand visualizations and dashboards. With Tableau, users can connect to a wide range of data sources, prepare and clean the data for analysis, and create interactive data visualizations such...
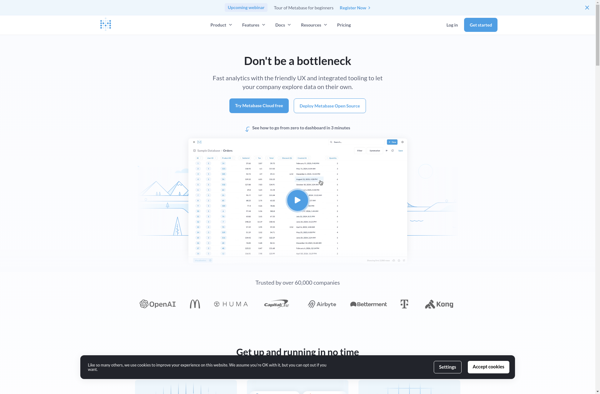
Metabase is an open source business intelligence platform and analytics tool. It allows anyone on a team to ask questions about their data, explore it, and share insights with others through easy-to-create dashboards, charts, and visualizations. Metabase provides an intuitive frontend interface so users can get answers and discover trends...
Looker Studio is a business intelligence and analytics platform designed to help companies analyze data and gain valuable insights. It provides an intuitive, web-based interface that enables users without technical skills to explore, visualize and share data easily.Some key capabilities and benefits of Looker Studio include:Interactive dashboards - Users can...
Google Charts is a robust and flexible JavaScript charting and data visualization library provided for free by Google. It offers developers a highly customizable way to create interactive charts, graphs, and data tables that seamlessly integrate into web pages and applications.With Google Charts, you can visualize complex data sets and...
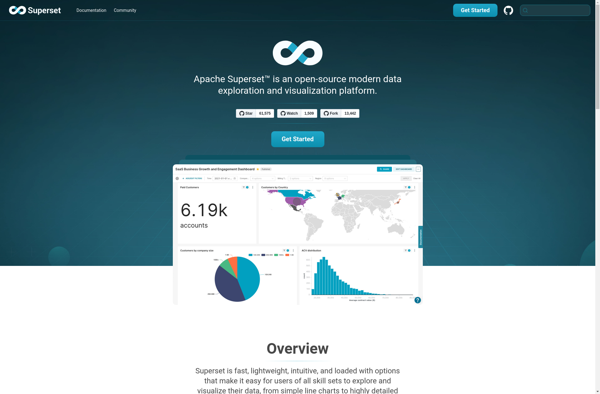
Apache Superset, formerly known as Caravel, is an open-source business intelligence (BI) web application. It was created by Maxime Beauchemin at Airbnb.Superset allows you to explore and visualize data, create interactive dashboards, and share insights across your organization. It integrates with common database technologies like MySQL, Postgres, SQL Server, and...
Pentaho is a comprehensive open source business intelligence (BI) suite that provides a range of data integration, analytics, visualization, reporting, data mining, and workflow capabilities. It is designed to help businesses consolidate data from disparate sources for unified analytics and reporting.Some of the key capabilities and components of Pentaho include:Data...
Plotly is an open-source graphing library that allows users to create interactive, publication-quality graphs, charts, and dashboards. It supports Python, R, JavaScript, and Excel as programming languages. Some key features of Plotly include:Interactive visualization - Plotly charts are interactive with features like hover text, zooming, panning, selectable legends, and editable...
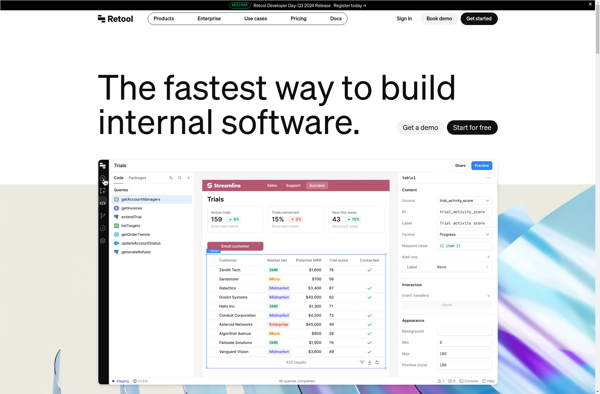
Retool is a low-code development platform designed to help teams build internal tools and business applications faster. It provides an easy-to-use drag and drop interface that allows you to quickly build workflows, forms, charts, kanban boards and more without needing to write any code.Some key features of Retool include:Connects to...
Redash is an open-source business intelligence and data visualization web application. It allows users to connect to multiple data sources including SQL databases, query and visualize the data, and create interactive dashboards to share insights.Some key features of Redash:Connect to data sources like PostgreSQL, MySQL, SQL Server, Redshift, BigQuery and...
Amazon QuickSight is a fast, cloud-powered business intelligence service that makes it easy to build visualizations, perform ad-hoc analysis, and quickly get business insights from your data. Some key features include:Intuitive visual interface that makes it easy to visualize and explore dataBroad data connectivity to connect to data sources like...
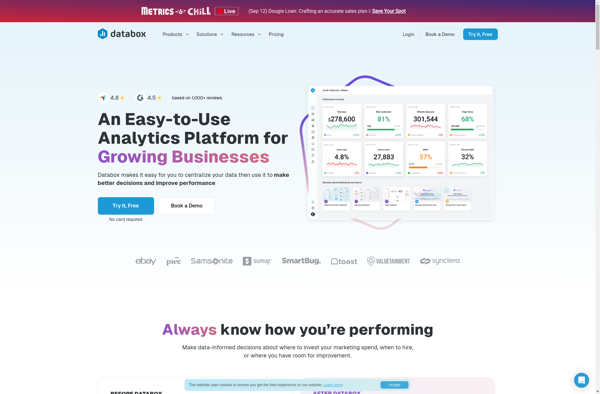
Databox is an open-source personal data platform that enables individuals to manage their personal data securely and privately. Developed by researchers at Imperial College London and the University of Cambridge, Databox allows users to connect data sources like smartphones, wearables, and web apps to feed data into the platform.Once data...
RAWGraphs is a free, open-source web tool created for anyone to easily visualize and share data using the most common graphical formats. The simple drag and drop interface makes it easy for non-experts to quickly generate a wide variety of charts and diagrams that can be exported and shared as...