Six Sigma Calculator

Six Sigma Calculator

Six Sigma Calculator is a free web-based tool that allows users to perform common Six Sigma statistical calculations. It includes functions for process capability analysis, statistical power analysis, DPMO/yield rate calculations, sample size estimation, and more.
Six Sigma Calculator image
six-sigma quality-control statistics calculator

Six Sigma Calculator: Free Web-Based Statistical Analysis Tool

Six Sigma Calculator is a free web-based tool that allows users to perform common Six Sigma statistical calculations. It includes functions for process capability analysis, statistical power analysis, DPMO/yield rate calculations, sample size estimation, and more.

What is Six Sigma Calculator?

The Six Sigma Calculator is a free online tool designed to help quality professionals, students, and others perform common statistical calculations used in Six Sigma and quality improvement projects. With an easy-to-use interface, it includes the following key features and functions:

  • Process Capability Analysis - Calculate Cp, Cpk, Pp, Ppk, and corresponding yields/DPMOs for your processes
  • Sample Size Estimation - Determine the recommended sample size for statistical analyses using power, confidence level, and other inputs
  • DOE/Experimental Design - Built-in tools for designing and analyzing factorial and fractional factorial experiments
  • Hypothesis Testing - Execute 1-sample, 2-sample, and variance hypothesis tests and identify statistical significance
  • Control Charts - Quickly construct variable and attribute control charts like Xbar-R, Xbar-S, Individuals, np, p, c, and u charts
  • Process Sigma Level - Convert DPMO and yield rates to process sigma levels for benchmarking
  • Data Transformation - Transform data sets using common methods like Box-Cox and Johnson transformations prior to analysis
  • Easy Reference Tables - Lookup z-scores, t-scores, critical values, and factors for common Six Sigma problem-solving

With an intuitive layout, examples for guidance, and tools for common Six Sigma techniques and analyses, the Six Sigma Calculator aims to be a valuable free resource for improving quality in products, processes, and systems.

Six Sigma Calculator Features

Features

  1. Statistical process control charts
  2. Process capability analysis
  3. DPMO/yield rate calculations
  4. Sample size estimation
  5. Hypothesis testing
  6. Measurement system analysis
  7. Gage R&R
  8. DOE analysis

Pricing

  • Free

Pros

Free to use

Simple and intuitive interface

Includes many common Six Sigma tools

Requires no software installation

Works on any device with a web browser

Cons

Limited features compared to full desktop apps

Requires internet connection

No ability to save/export data

Lacks advanced statistical capabilities


The Best Six Sigma Calculator Alternatives

Top Business & Commerce and Quality Control & Improvement and other similar apps like Six Sigma Calculator


R (programming language) icon

R (programming language)

R is an open-source programming language and free software environment for statistical computing, bioinformatics, graphics, data science, and general-purpose programming. The R language provides a wide variety of statistical analysis techniques and graphical capabilities which make it a popular choice for data analysis and visualization.Some key features of R include:Open-source...
R (programming language) image
IBM SPSS Statistics icon

IBM SPSS Statistics

IBM SPSS Statistics is a comprehensive software platform for statistical analysis in business, science, and social science research. First released in 1968, SPSS Statistics helps users apply complex statistical analyses and predictive analytics to unlock impactful insights from data.Key features and capabilities of SPSS Statistics include:Descriptive statistics like means, standard...
IBM SPSS Statistics image
Minitab icon

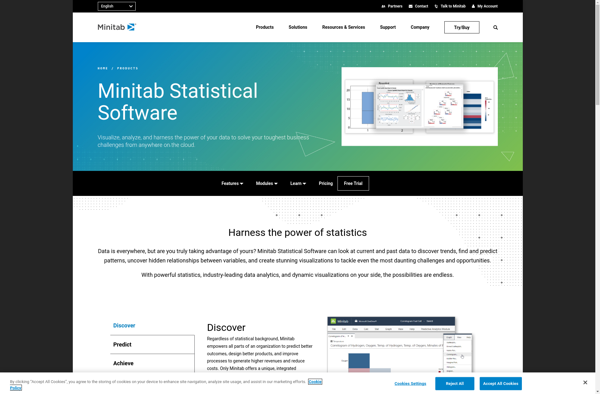
Minitab

Minitab is a comprehensive software package used for statistical analysis and quality improvement applications. It has a wide range of analytical capabilities including basic statistics, regression analysis, design of experiments, statistical process control charts, reliability analysis, and more.Some key features and benefits of Minitab:User-friendly spreadsheet-style interface for entering, viewing, and...
Minitab image
STATISTICA icon

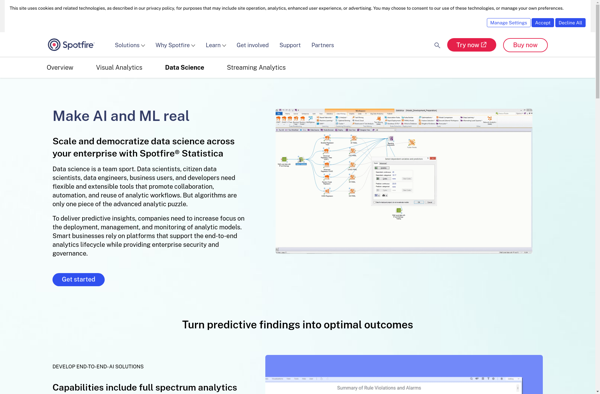
STATISTICA

STATISTICA is a powerful and comprehensive data analysis software suite that has been developed over 30+ years by StatSoft. It provides analytics capabilities for a wide range of industries and applications.Key features of STATISTICA include:Advanced data visualization with interactive dashboards, graphs and chartsPredictive analytics and data mining algorithms like regression,...
STATISTICA image
Stata icon

Stata

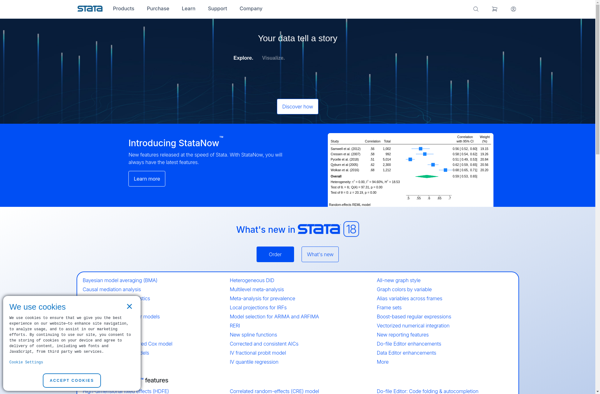
Stata is statistical software that is widely used by researchers in economics, political science, biomedicine, sociology, and other fields that require advanced statistical analysis and data visualization capabilities. It was first launched in 1985 by StataCorp and has since become one of the most popular statistical packages in academic research.Some...
Stata image
PSPP icon

PSPP

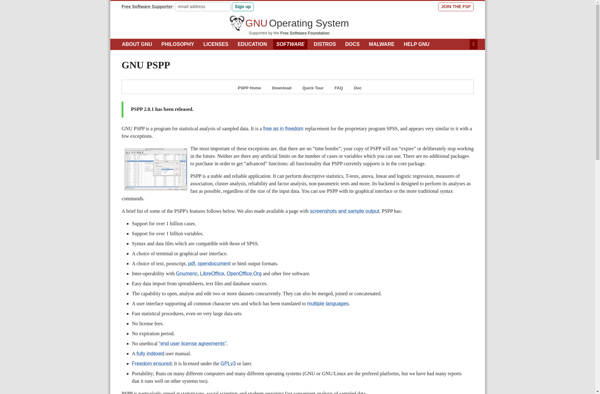
PSPP is a free and open source alternative to the proprietary IBM SPSS Statistics software. It aims to provide similar capabilities and features for statistical analysis, data management, and graphics as SPSS Statistics does, while being available at no cost under the GNU General Public License.Some key features and capabilities...
PSPP image
Montecarlito icon

Montecarlito

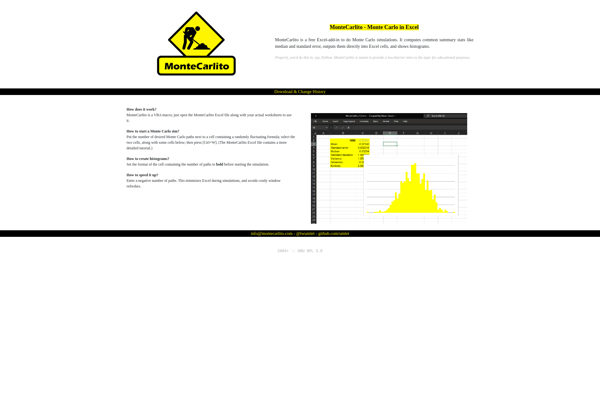
Montecarlito is an open-source typeface inspired by Times New Roman. It was created in 2018 by typographers Cadson Demak and Jacques Le Bailly to provide an alternative typeface that avoids the licensing restrictions of Times New Roman.Montecarlito has the same metrics as Times New Roman so it can be used...
Montecarlito image
SOFA Statistics icon

SOFA Statistics

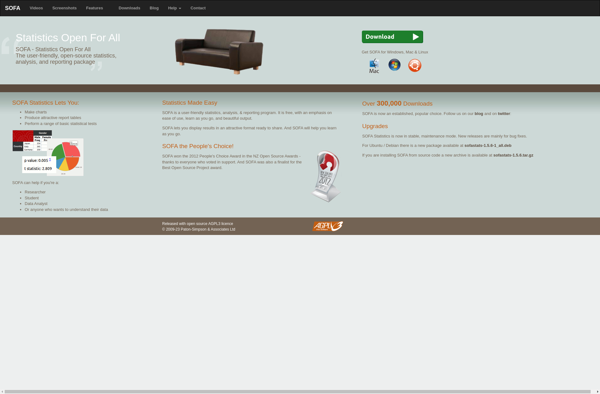
SOFA Statistics is a user-friendly, open-source statistics, analysis, and reporting tool that runs as a desktop application on Windows, Mac, and Linux. It provides an extensive range of statistical methods and visualization tools for exploratory data analysis, data cleaning, model fitting, results reporting, and dashboard creation.Some key features of SOFA...
SOFA Statistics image
The R Commander icon

The R Commander

The R Commander is a basic-statistics graphical user interface for R, an open source programming language and software environment for statistical analysis, data manipulation, and graphics visualization. The R Commander provides a simple way to utilize many R features through menus, dialog boxes, and other user interface controls rather than...
The R Commander image
Easytab icon

Easytab

EasyTab is a free, open-source guitar tablature editor for Windows. It aims to provide an intuitive interface for creating, editing, printing and listening to tablature files for guitar and other fretted instruments.Some of the key features of EasyTab include:Simple, straightforward interface for entering and editing tablatureMIDI playback to hear how...
PAST - PAlaeontological STatistics icon

PAST - PAlaeontological STatistics

PAST is a comprehensive, user-friendly software package for scientific data analysis, with a focus on paleontology and paleobiology research. Developed by researchers at the University of Oslo, PAST provides a wide range of analytical tools and statistical tests within an intuitive graphical user interface.Key features of PAST include:Data manipulation -...
PAST - PAlaeontological STatistics image
SHAZAM (statistical analysis) icon

SHAZAM (statistical analysis)

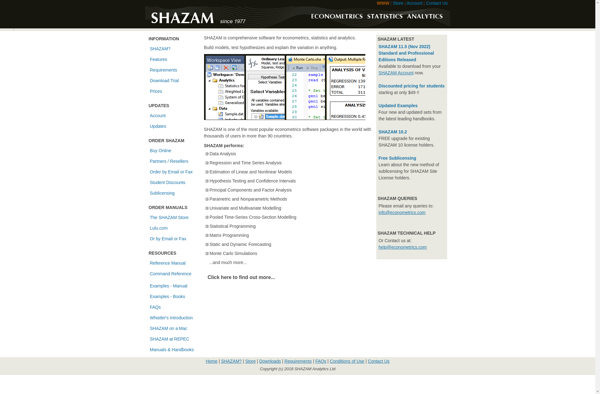
SHAZAM is a comprehensive econometrics and statistical analysis software package used widely in economics, finance, and other data-driven fields. It was originally developed at the University of British Columbia in the 1970s and has been continually updated and expanded since then.Some of the key features and capabilities of SHAZAM include:Time...
SHAZAM (statistical analysis) image
Statwing icon

Statwing

Statwing is a cloud-based statistical analysis and reporting software designed for ease of use by non-technical people. It provides an intuitive drag-and-drop interface that allows users to quickly conduct statistical tests, make customizable graphs and charts, and generate reports without coding.Some key features of Statwing include:Conduct common statistical tests like...
Statwing image