DataCracker is a data analytics and business intelligence platform that allows users to easily connect, prepare, and analyze data from multiple sources. It provides self-service BI capabilities such as drag-and-drop dashboard and report building, along with data modeling, ETL, an
DataCracker: Data Analytics and Business Intelligence Platform
DataCracker is a data analytics and business intelligence platform that allows users to easily connect, prepare, and analyze data from multiple sources. It provides self-service BI capabilities such as drag-and-drop dashboard and report building, along with data modeling, ETL, and predictive analytics.
What is DataCracker?
DataCracker is a versatile business intelligence and analytics platform designed to help companies make data-driven decisions. It allows users to connect to various data sources, combine and transform data for analysis, and create interactive dashboards and reports to share insights.
Some key features of DataCracker include:
Drag-and-drop interface for building dashboards, reports, and data flows visually without coding
Connectors for databases, cloud apps, files, APIs, and more data sources
Powerful ETL (extract, transform, load) for cleaning, shaping, and combining data
Collaboration tools for sharing dashboards and insights across the organization
Predictive analytics capabilities like forecasting, regression, and machine learning algorithms
Flexible pricing options including pay-as-you-go cloud subscription plans
Companies use DataCracker BI to track KPIs, analyze trends, identify growth opportunities, and monitor business performance more effectively. Its self-service analytics capabilities enable a wide range of users to make data-driven decisions faster without relying on IT or data experts.
R is an open-source programming language and free software environment for statistical computing, bioinformatics, graphics, data science, and general-purpose programming. The R language provides a wide variety of statistical analysis techniques and graphical capabilities which make it a popular choice for data analysis and visualization.Some key features of R include:Open-source...
IBM SPSS Statistics is a comprehensive software platform for statistical analysis in business, science, and social science research. First released in 1968, SPSS Statistics helps users apply complex statistical analyses and predictive analytics to unlock impactful insights from data.Key features and capabilities of SPSS Statistics include:Descriptive statistics like means, standard...
Minitab is a comprehensive software package used for statistical analysis and quality improvement applications. It has a wide range of analytical capabilities including basic statistics, regression analysis, design of experiments, statistical process control charts, reliability analysis, and more.Some key features and benefits of Minitab:User-friendly spreadsheet-style interface for entering, viewing, and...
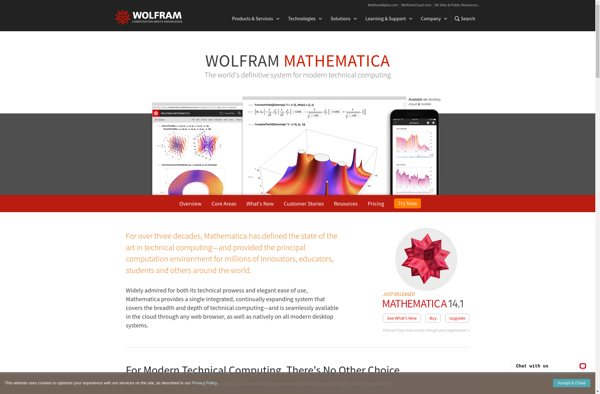
Mathematica is a computational software program developed by Wolfram Research. It is used for symbolic and numerical mathematics, data visualization, image processing, and a wide range of technical computing applications.Some key features of Mathematica include:A symbolic algebra engine that can manipulate mathematical expressions, solve equations, simplify expressions, compute derivatives and...
MATLAB (matrix laboratory) is a multi-paradigm numerical computing environment and proprietary programming language developed by MathWorks. MATLAB allows matrix manipulations, plotting of functions and data, implementation of algorithms, creation of user interfaces, and interfacing with programs written in other languages.Some key features of MATLAB include:Matrix and array-oriented language for faster...
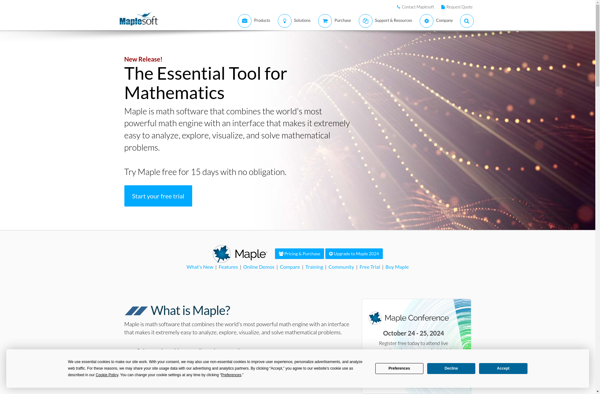
Maple is a proprietary computer algebra system or CAS designed for mathematical computation and modeling. It was first developed in 1980 by the Symbolic Computation Group at the University of Waterloo in Canada.Some of the key capabilities Maple offers include:Algebraic manipulation - simplify expressions, solve equations, factor polynomials, compute limits,...
RStudio is a popular open-source IDE for R, a programming language for statistical computing and graphics. It provides a user-friendly graphical user interface that makes working with R much easier by integrating tools for plotting, debugging, workspace management, and other features.Some key features of RStudio include:Code editor with syntax highlighting,...
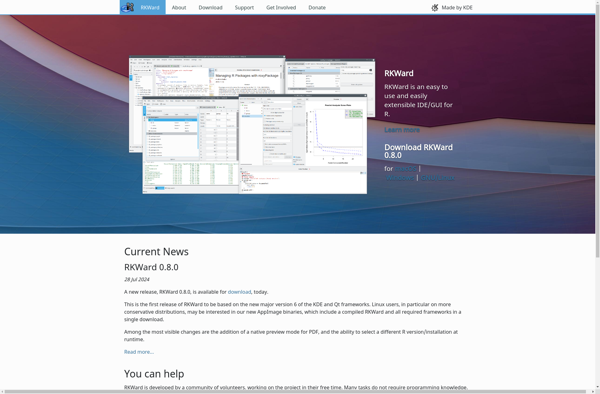
RKWard is a free and open-source integrated development environment for the R statistical programming language. It provides a graphical user interface that allows users to work with R without needing to manually type code.Some key features of RKWard include:Code editor with syntax highlighting, auto-completion and other productivity toolsData viewer to...
PSPP is a free and open source alternative to the proprietary IBM SPSS Statistics software. It aims to provide similar capabilities and features for statistical analysis, data management, and graphics as SPSS Statistics does, while being available at no cost under the GNU General Public License.Some key features and capabilities...
SymPy is an open-source Python library for symbolic mathematics. It enables users to manipulate mathematical expressions, solve equations, expand functions into series, calculate limits, take derivatives and integrals, work with matrices, plot graphs, and more.Some key features of SymPy include:Symbolic calculation engine that can perform arithmetic, algebra, calculus, discrete math,...
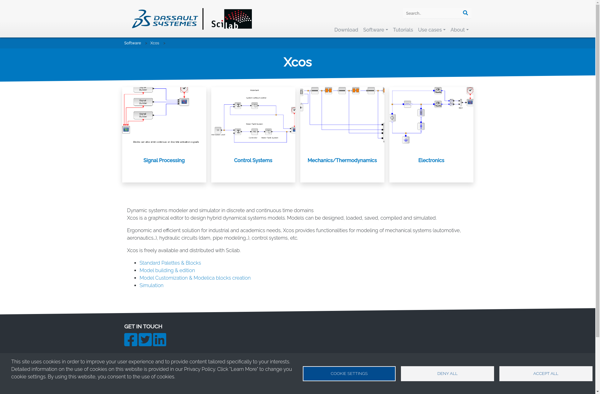
Xcos is an open-source software specialized in the simulation of dynamical systems, offering modeling and simulation features specifically oriented towards control systems. It is developed as a graphical user interface module for Scilab, the open source platform for numerical computation.Some key features of Xcos include:Block diagram model editor for building...
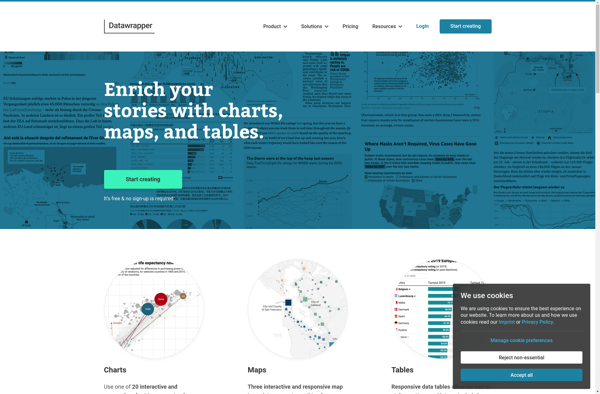
Datawrapper is a powerful yet user-friendly data visualization tool used by journalists, researchers, NGOs, and businesses to create interactive charts, graphs, and maps. Its drag-and-drop interface makes it easy for anyone to visualize data without needing to know how to code.Some key features of Datawrapper include:Various chart types including bar...