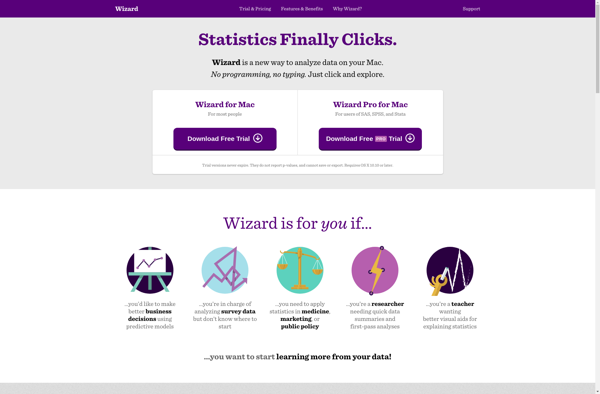
Wizard Pro is a digital design and prototyping tool that allows users to rapidly create wireframes, mockups, prototypes, and specs for web and mobile apps. It has a simple and intuitive drag-and-drop interface to design responsive layouts across multiple devices.
A user-friendly tool for creating wireframes, mockups, prototypes, and specs for web and mobile apps with a simple drag-and-drop interface for responsive design across multiple devices.
What is Wizard Pro?
Wizard Pro is a leading digital design and prototyping platform used by designers, developers, product managers, and marketers to design, prototype, and share interactive app and website mockups. It provides a quick and simple way to create wireframes, prototypes, UI specs, style guides, design systems, and high-fidelity interactive prototypes for web, mobile, tablet, and desktop apps.
Key features include:
Intuitive drag-and-drop editor to rapidly build wireframes and interactive prototypes
Vast component libraries with thousands of UI elements, icons, gestures, and interaction patterns
Responsive prototyping to design adaptive layouts for mobile, tablet and desktop
Real-time collaboration allowing teams to work together on prototypes
Interactive links, dynamic data, logic, and transitions to simulate real app behavior
Instant sharing via public links, Slack, Jira integration and more
Support for exporting design assets in multiple formats
Overall, Wizard Pro speeds up design iteration, reduces rework, improves team collaboration and ensures designs meet user needs. With an intuitive interface and comprehensive toolset tailored for modern application design, Wizard Pro is considered an essential tool for designers and developers alike.
Wizard Pro Features
Features
Drag-and-drop interface for rapid prototyping
Responsive design across multiple devices
Wireframing and mockup creation
Collaboration and team workflow tools
Interaction and animation capabilities
Exporting designs to various formats
Pricing
Freemium
Subscription-Based
Pros
Intuitive and user-friendly interface
Efficient prototyping workflow
Supports responsive design
Collaborative features for teamwork
Extensive library of UI elements and templates
Cons
Limited customization options for advanced users
Potential performance issues with large or complex projects
R is an open-source programming language and free software environment for statistical computing, bioinformatics, graphics, data science, and general-purpose programming. The R language provides a wide variety of statistical analysis techniques and graphical capabilities which make it a popular choice for data analysis and visualization.Some key features of R include:Open-source...
IBM SPSS Statistics is a comprehensive software platform for statistical analysis in business, science, and social science research. First released in 1968, SPSS Statistics helps users apply complex statistical analyses and predictive analytics to unlock impactful insights from data.Key features and capabilities of SPSS Statistics include:Descriptive statistics like means, standard...
Minitab is a comprehensive software package used for statistical analysis and quality improvement applications. It has a wide range of analytical capabilities including basic statistics, regression analysis, design of experiments, statistical process control charts, reliability analysis, and more.Some key features and benefits of Minitab:User-friendly spreadsheet-style interface for entering, viewing, and...
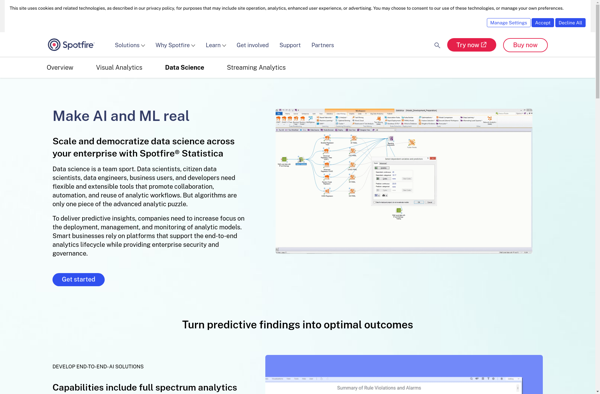
STATISTICA is a powerful and comprehensive data analysis software suite that has been developed over 30+ years by StatSoft. It provides analytics capabilities for a wide range of industries and applications.Key features of STATISTICA include:Advanced data visualization with interactive dashboards, graphs and chartsPredictive analytics and data mining algorithms like regression,...
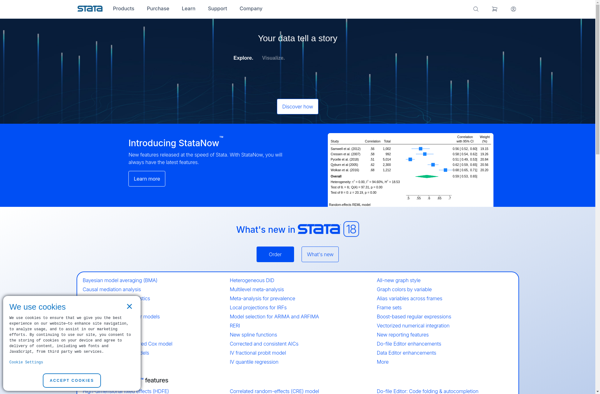
Stata is statistical software that is widely used by researchers in economics, political science, biomedicine, sociology, and other fields that require advanced statistical analysis and data visualization capabilities. It was first launched in 1985 by StataCorp and has since become one of the most popular statistical packages in academic research.Some...
PSPP is a free and open source alternative to the proprietary IBM SPSS Statistics software. It aims to provide similar capabilities and features for statistical analysis, data management, and graphics as SPSS Statistics does, while being available at no cost under the GNU General Public License.Some key features and capabilities...
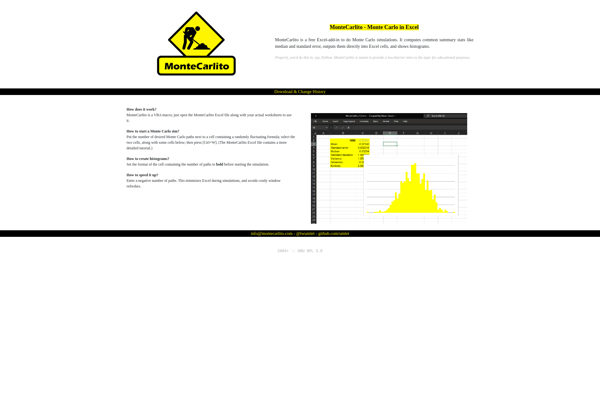
Montecarlito is an open-source typeface inspired by Times New Roman. It was created in 2018 by typographers Cadson Demak and Jacques Le Bailly to provide an alternative typeface that avoids the licensing restrictions of Times New Roman.Montecarlito has the same metrics as Times New Roman so it can be used...
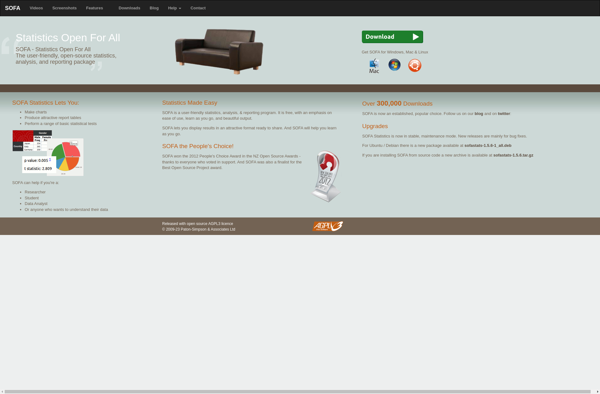
SOFA Statistics is a user-friendly, open-source statistics, analysis, and reporting tool that runs as a desktop application on Windows, Mac, and Linux. It provides an extensive range of statistical methods and visualization tools for exploratory data analysis, data cleaning, model fitting, results reporting, and dashboard creation.Some key features of SOFA...
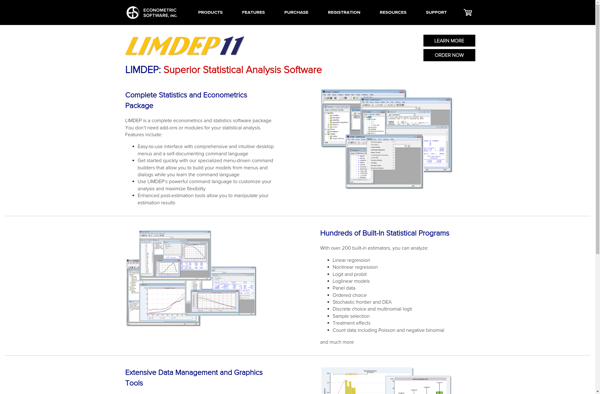
LIMDEP (Limited Dependent Variable Modeling) is proprietary econometrics software developed and sold by Econometric Software, Inc. It is used by economists, statisticians, analysts, and other researchers for economic modeling, forecasting, data analysis, and policy evaluation.Some key features of LIMDEP include:Tools for estimating a wide variety of econometric models including regression...
The R Commander is a basic-statistics graphical user interface for R, an open source programming language and software environment for statistical analysis, data manipulation, and graphics visualization. The R Commander provides a simple way to utilize many R features through menus, dialog boxes, and other user interface controls rather than...
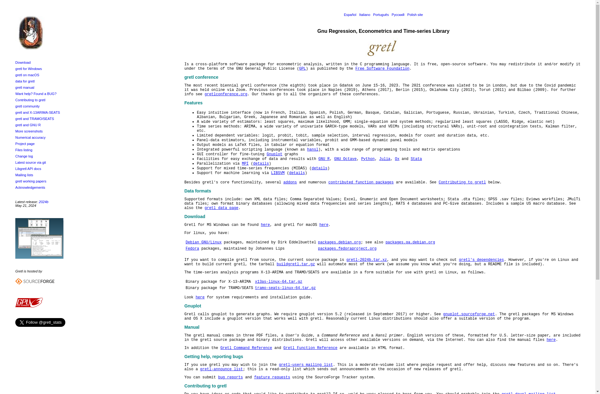
gretl is an open-source software package for econometric analysis. It supports a wide range of statistical techniques relevant to econometrics, such as cross-section, panel data, time series, nonparametric estimators, maximum likelihood, and general nonlinear least squares.Some key features of gretl include:User-friendly graphical interface for data entry, analysis, and visualizationScripting functionality...