Causal

Causal: No-Code Causal Data Analysis Platform
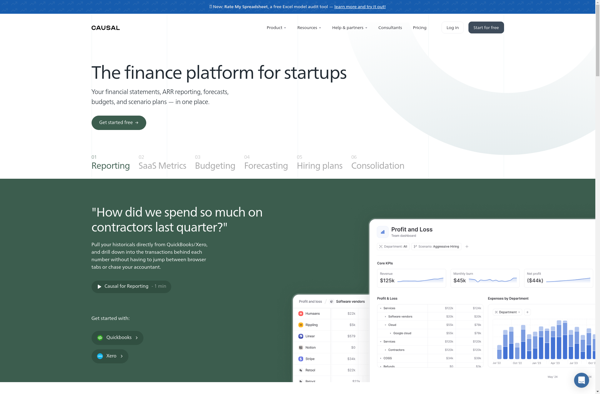
Causal is a no-code platform that enables anyone to analyze the core drivers of business metrics using statistical methods. It makes causal data analysis accessible with an easy-to-use interface to upload data, run analyses, and get clear, actionable insights.
What is Causal?
Causal is a software platform designed to help companies and analysts better understand what factors drive changes in key business metrics. It utilizes statistical and machine learning techniques to determine causal relationships in data, as opposed to just correlations.
Here are some key capabilities of Causal:
- Upload transactional data from databases, cloud services, etc. The system can integrate with many data sources.
- Set up dashboards to track KPIs and metrics you want to optimize like revenue, conversions, engagement.
- Leverage automated statistical analysis to identify significant drivers of changes in your metrics, both positive and negative drivers.
- Conduct what-if scenario analysis by manipulating driver values to estimate impact on KPIs. For example, how would a 10% increase in advertising spend impact conversions?
- Generate clear reports and visualizations to communicate insights to stakeholders across the organization.
- Designed for business users and analysts - no coding or data science expertise required to operate the platform.
Some key benefits of using Causal include faster and deeper data-driven insight generation, the ability to track metric drivers over time, and estimating the causal impact of potential changes before deploying resources. It enables companies to optimize spending, processes, and strategy based on statistically rigorous and visually intuitive analysis.
Causal Features
Features
- Upload data from CSV, databases, etc.
- Automatically detect relationships between metrics
- Run analyses like regression and segmentation
- Visualize results through charts and graphs
- Collaborate by sharing projects and insights
- Integrate with data warehouses and BI tools
Pricing
- Free
- Subscription-Based
Pros
Cons
Official Links
Reviews & Ratings
Login to ReviewThe Best Causal Alternatives
Top Ai Tools & Services and Data Analysis and other similar apps like Causal
Here are some alternatives to Causal:
Suggest an alternative ❐Microsoft Excel

Tableau

Google Sheets

Pry Financials
