Parquet Data Viewer
Parquet Data Viewer: Explore & Analyze Parquet Files
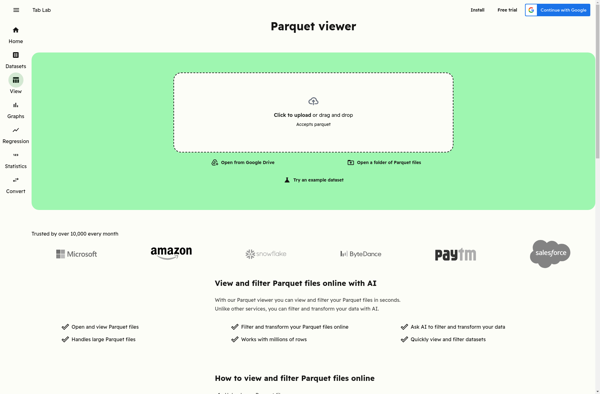
An open-source tool for visually exploring and analyzing Parquet files, allowing you to view data structures, preview values, run SQL queries, and generate statistics.
What is Parquet Data Viewer?
Parquet Data Viewer is an open-source, cross-platform application for visually analyzing and exploring Parquet data files. Developed by Atlan, it provides an intuitive graphical interface to examine the contents of Parquet files without needing to write code.
With Parquet Data Viewer, you can quickly:
- See the data types, compression types, row group information, and full schema of Parquet datasets
- Preview actual values in the Parquet file to verify the data
- Run SQL queries on Parquet data to filter, aggregate, and analyze
- View queried data visually with charts and statistics
- Export queried Parquet data as CSV/JSON for further analysis
Key features include a schema browser, data preview, SQL editor with visualization, and the ability to handle very large Parquet files with fast response times. The tool is written in Java and works on Windows, Mac OS X, and Linux.
Parquet Data Viewer makes inspecting, diagnosing, and exploring Parquet data intuitive and efficient for both technical and non-technical users. It's an indispensable tool for data engineers, analysts, and data scientists working with the popular columnar data format.
Parquet Data Viewer Features
Features
- Visualize Parquet file structures
- Preview data values
- Run SQL queries against Parquet files
- Generate statistics on Parquet data
- Support for complex data types
- Filtering and searching data
- Export query results
Pricing
- Open Source
Pros
Cons
Official Links
Reviews & Ratings
Login to ReviewThe Best Parquet Data Viewer Alternatives
View all Parquet Data Viewer alternatives with detailed comparison →
Top Data & Analytics and Data Visualization and other similar apps like Parquet Data Viewer
Here are some alternatives to Parquet Data Viewer:
Suggest an alternative ❐Microsoft Power BI

Tableau

Metabase
Talend
Looker Studio

Apache Superset
Plotly
