Mode Analytics

Mode Analytics

Mode Analytics is a cloud-based business intelligence and analytics platform that allows users to visualize, analyze, and share data. It has drag-and-drop functionality to build reports, dashboards, and workflows that provide actionable insights.
Mode Analytics image
analytics visualization dashboards reports

Mode Analytics: Cloud-Based Business Intelligence Platform

Cloud-based business intelligence and analytics platform with drag-and-drop functionality for building reports, dashboards, and workflows to gain actionable insights.

What is Mode Analytics?

Mode Analytics is a powerful, cloud-based business intelligence and analytics platform designed to help companies visualize, analyze, and share data to drive better business decisions. With an intuitive drag-and-drop interface, Mode makes it easy for users to connect multiple data sources, build interactive reports and dashboards, and collaborate across teams.

Some key capabilities and benefits of Mode Analytics include:

  • Flexible data connections to cloud apps, databases, data warehouses, and more with no ETL required
  • Interactive data exploration with filtering, segmentation, statistical analysis, and geospatial mapping
  • Customizable reporting through pixel-perfect layouts, advanced calculations, parameters, and contextual insights
  • Interactive dashboards with advanced charting, drill-down analytics, and scheduling
  • Automated workflows for alerts, monitoring, and operational analytics
  • Enterprise-grade security, access controls, and governance
  • Team collaboration features like comments, @mentions, and message boards
  • White label embedding and API access for custom apps and models

With an elegant interface optimized for ease-of-use, Mode makes it simple for anyone to discover and share data-driven insights. The platform scales to handle billions of rows of data while delivering fast query performance and reliability. Mode can be used by individuals, teams, and organizations of all sizes looking to make smarter decisions with data.

Mode Analytics Features

Features

  1. Drag-and-drop interface to build reports, dashboards and workflows
  2. Connects to databases, data warehouses, cloud apps and files
  3. Collaboration tools to share insights across teams
  4. Advanced analytics with R and Python integration
  5. Automated alerting and scheduled delivery
  6. Mobile optimization and white labeling

Pricing

  • Freemium
  • Subscription-Based

Pros

Intuitive and easy to use

Scales to large datasets

Great support and community resources

Integrates well with other tools via API

Flexible pricing options

Cons

Steep learning curve for advanced features

Limited customization compared to open-source BI tools

Can be pricey for larger organizations

Not ideal for complex real-time analytics


The Best Mode Analytics Alternatives

Top Business & Commerce and Business Intelligence and other similar apps like Mode Analytics


Tableau icon

Tableau

Tableau is a leading business intelligence and data visualization platform used by organizations of all sizes to transform their data into easy-to-understand visualizations and dashboards. With Tableau, users can connect to a wide range of data sources, prepare and clean the data for analysis, and create interactive data visualizations such...
Tableau image
JasperReports icon

JasperReports

JasperReports is an open source Java reporting library that can generate various types of reports from different data sources. It is very flexible and offers many features:Supports connecting to various data sources like SQL databases, NoSQL databases, XML, JSON, CSV files, etc.Can generate reports in multiple formats including PDF, HTML,...
JasperReports image
Pentaho icon

Pentaho

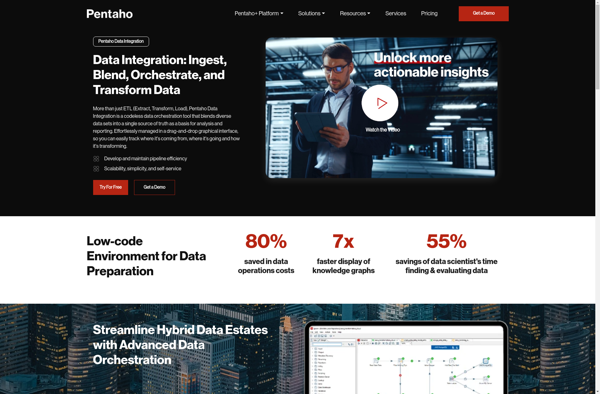
Pentaho is a comprehensive open source business intelligence (BI) suite that provides a range of data integration, analytics, visualization, reporting, data mining, and workflow capabilities. It is designed to help businesses consolidate data from disparate sources for unified analytics and reporting.Some of the key capabilities and components of Pentaho include:Data...
Pentaho image
Retool icon

Retool

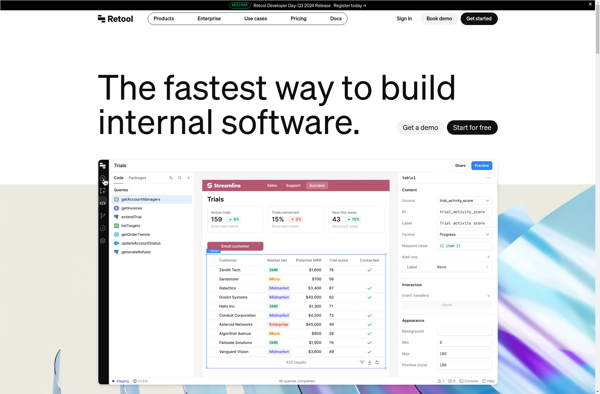
Retool is a low-code development platform designed to help teams build internal tools and business applications faster. It provides an easy-to-use drag and drop interface that allows you to quickly build workflows, forms, charts, kanban boards and more without needing to write any code.Some key features of Retool include:Connects to...
Retool image
Redash icon

Redash

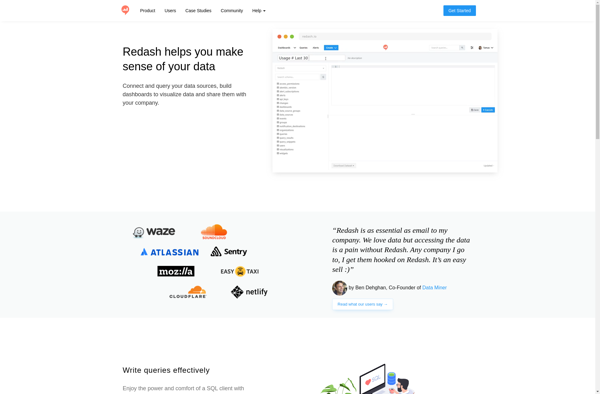
Redash is an open-source business intelligence and data visualization web application. It allows users to connect to multiple data sources including SQL databases, query and visualize the data, and create interactive dashboards to share insights.Some key features of Redash:Connect to data sources like PostgreSQL, MySQL, SQL Server, Redshift, BigQuery and...
Redash image
Sisense icon

Sisense

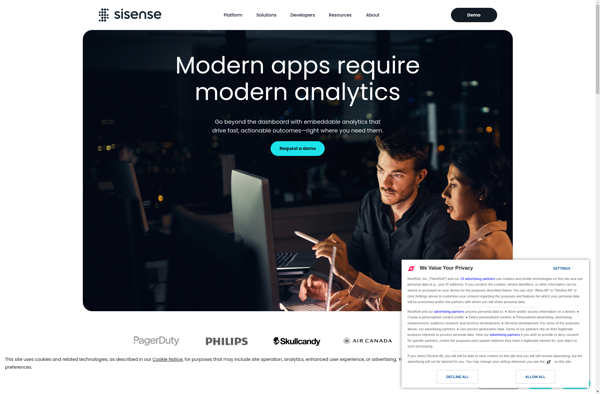
Sisense is a business intelligence and data analytics software platform designed to help non-technical users prepare, analyze and visualize complex data. Some key features of Sisense include:Intuitive drag-and-drop interface for building interactive dashboards and visualizations like charts, graphs and pivot tables without coding.Ability to connect to wide variety of data...
Sisense image
PopSQL icon

PopSQL

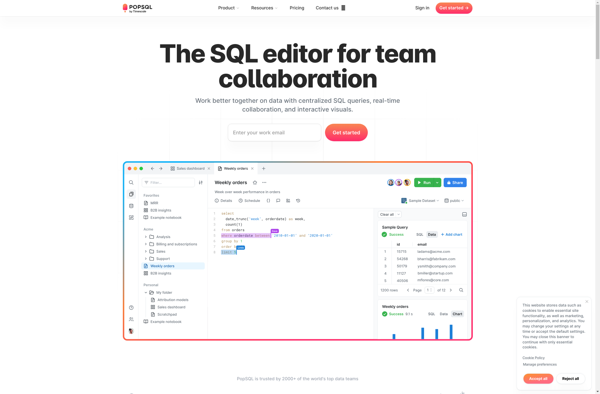
PopSQL is a cloud-based SQL editor that enables teams to collaborate on exploring and analyzing data. It provides an intuitive, browser-based interface for writing queries, visualizing results, and sharing data insights.Key features of PopSQL include:Collaborative editing - Multiple users can query the same datasets, share queries and visualizations, comment, and...
PopSQL image
Cloudera CDH icon

Cloudera CDH

Cloudera CDH (Cloudera Distribution Including Apache Hadoop) is an open source, scalable data management and analytics platform powered by Apache Hadoop and related open source projects. CDH brings together HDFS for scalable and resilient storage, YARN for cluster resource management, Spark for in-memory processing, Hive and Impala for SQL analytics,...
Cloudera CDH image
Google Cloud Dataproc icon

Google Cloud Dataproc

Google Cloud Dataproc is a fast, easy-to-use, fully-managed cloud service for running Apache Spark and Apache Hadoop clusters. Key features include:Fully managed - no need to manually install, configure, or tune Apache Spark and Apache Hadoop clustersFast cluster creation - clusters spin up in 90 seconds or less so you...
Google Cloud Dataproc image
Greenplum HD icon

Greenplum HD

Greenplum HD is an open-source distributed database based on PostgreSQL designed for big data analytics workloads. It provides massively parallel processing (MPP) capabilities to enable fast execution of analytical queries across large volumes of data.Some key features of Greenplum HD include:Open-source - available free under the Apache 2 licenseMassively parallel...
IBM InfoSphere BigInsights icon

IBM InfoSphere BigInsights

IBM InfoSphere BigInsights is a software platform built on Apache Hadoop for analyzing large volumes of structured and unstructured data. Key features include:Flexible data processing and storage for both structured and unstructured dataEnterprise-grade performance, security, and reliabilityPre-built data connectors, text analytics, and machine learning capabilitiesTools for data governance, discovery, and...
IBM InfoSphere BigInsights image
Amazon EMR icon

Amazon EMR

Amazon EMR is a managed cluster platform that simplifies running big data frameworks like Apache Hadoop and Apache Spark on AWS. Amazon EMR automatically scales compute and storage resources as needed, making it easy to process vast amounts of data efficiently and cost-effectively.Key features of Amazon EMR include:Fully managed Hadoop...
Amazon EMR image