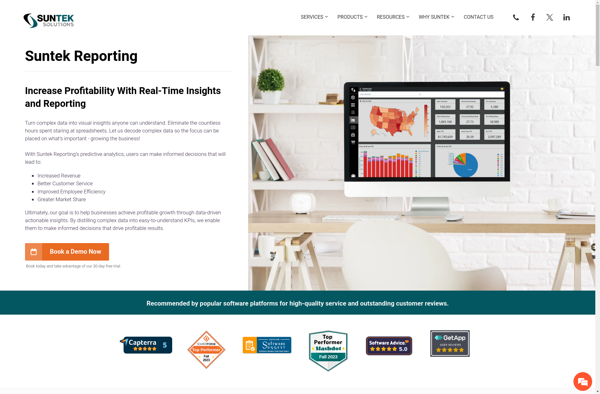
Suntek Reporting
Suntek Reporting is a business intelligence and reporting software that allows users to create customizable reports and dashboards from their data. It connects to various data sources and has drag-and-drop functionality to build reports quickly.
Suntek Reporting: Business Intelligence and Reporting Software
Business intelligence and reporting software for creating customizable reports and dashboards from your data, connecting to various sources with drag-and-drop functionality
What is Suntek Reporting?
Suntek Reporting is a flexible business intelligence and reporting solution designed to help companies gain better insights from their data. Some key features include:
- Intuitive drag-and-drop interface to build reports and dashboards quickly without coding
- Connectivity to a wide range of data sources including SQL Server, MySQL, Oracle, AWS, and more
- Powerful data visualization with charts, graphs, and gauges for better data analysis
- Scheduled report delivery to email or file shares
- Collaborative features like report sharing, annotations, and discussions to promote teamwork
- Robust permission and access control capabilities
- Custom report styling and white labeling options
- APIs and integrations with third-party apps
- On-premises or cloud deployment options
With its user-friendly interface, flexible reporting designer, and scalable architecture, Suntek Reporting is well-suited for modern business intelligence needs across industries like healthcare, finance, retail, and more.
Suntek Reporting Features
Features
- Drag-and-drop report designer
- Connects to various data sources like SQL Server, Oracle, MySQL etc
- Has library of customizable report templates
- Allows scheduling and distributing reports
- Has interactive dashboards and charts
- Supports ad-hoc reporting
- Has role-based security
Pricing
- Subscription-Based
Pros
User-friendly interface
Fast and easy report creation
Good connectivity to data sources
Interactive visualizations
Scalable to large data volumes
Cons
Steep learning curve for advanced features
Limited options for custom coding
Not ideal for complex or pixel-perfect reporting
Requires database knowledge for data modeling
Official Links
Reviews & Ratings
Login to ReviewThe Best Suntek Reporting Alternatives
View all Suntek Reporting alternatives with detailed comparison →
Top Business & Commerce and Business Intelligence & Analytics and other similar apps like Suntek Reporting
Here are some alternatives to Suntek Reporting:
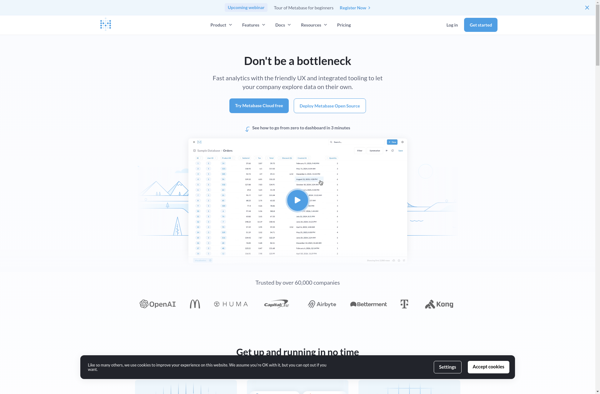
Suggest an alternative ❐Metabase
Metabase is an open source business intelligence platform and analytics tool. It allows anyone on a team to ask questions about their data, explore it, and share insights with others through easy-to-create dashboards, charts, and visualizations. Metabase provides an intuitive frontend interface so users can get answers and discover trends...
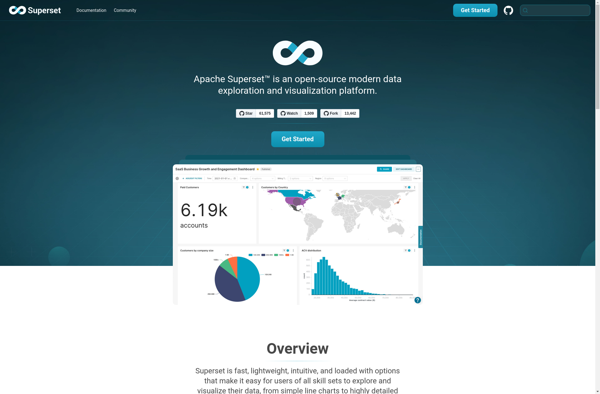
Apache Superset
Apache Superset, formerly known as Caravel, is an open-source business intelligence (BI) web application. It was created by Maxime Beauchemin at Airbnb.Superset allows you to explore and visualize data, create interactive dashboards, and share insights across your organization. It integrates with common database technologies like MySQL, Postgres, SQL Server, and...
Pentaho
Pentaho is a comprehensive open source business intelligence (BI) suite that provides a range of data integration, analytics, visualization, reporting, data mining, and workflow capabilities. It is designed to help businesses consolidate data from disparate sources for unified analytics and reporting.Some of the key capabilities and components of Pentaho include:Data...

Redash
Redash is an open-source business intelligence and data visualization web application. It allows users to connect to multiple data sources including SQL databases, query and visualize the data, and create interactive dashboards to share insights.Some key features of Redash:Connect to data sources like PostgreSQL, MySQL, SQL Server, Redshift, BigQuery and...
