Insights for ArcGIS
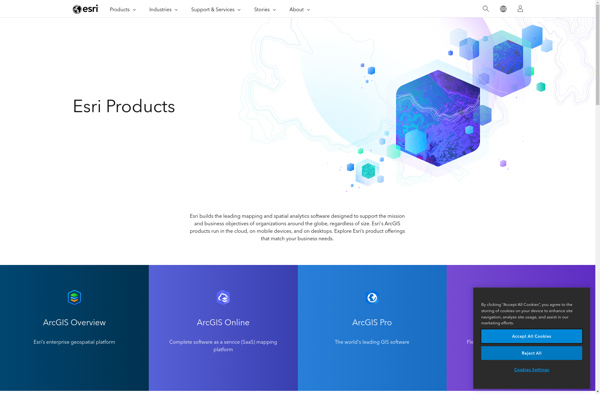
Insights for ArcGIS
A cloud-based location analytics solution by Esri that allows users to explore, analyze, and share spatial data through interactive visualizations, enabling fast and easy analysis without coding or GIS expertise.
What is Insights for ArcGIS?
Insights for ArcGIS is a powerful cloud-based location analytics solution by Esri for exploring, analyzing, and sharing spatial data through interactive data visualizations. As an all-in-one solution, Insights provides intuitive drag-and-drop tools that empower users of all skill levels to gain deeper insights into their data, identify patterns and trends, and share stories without needing to code or have extensive GIS expertise.
With Insights, users can connect to and visualize spatial data from a variety of sources including ArcGIS Online, ArcGIS Enterprise, Excel files, CSVs and more. Using the drag-and-drop interface, users can easily create customized maps, charts, dashboards and other visuals tailored to their analysis needs. Insights also includes over 30 smart mapping preconfigurations for commonly used visualizations. Users can interactively filter, select or query the visuals to seamlessly explore data on the fly.
Insights makes it simple to uncover key information and share meaningful analytics through web experiences that convey information clearly to audiences. The interactive dashboards can be easily shared through a simple URL link or embedded into any web or blog site for communicating findings dynamically. With cloud scalability and governance capabilities, Insights is an accessible yet powerful solution for location-based analytics.
Insights for ArcGIS Features
Features
- Interactive data visualizations
- Drag-and-drop analysis tools
- Smart mapping capabilities
- Data enrichment
- Location analytics
- Real-time monitoring
- Collaboration tools
Pricing
- Subscription-Based
Pros
Cons
Official Links
Reviews & Ratings
Login to ReviewThe Best Insights for ArcGIS Alternatives
View all Insights for ArcGIS alternatives with detailed comparison →
Top Ai Tools & Services and Spatial Analytics and other similar apps like Insights for ArcGIS
Here are some alternatives to Insights for ArcGIS:
Suggest an alternative ❐Microsoft Power BI

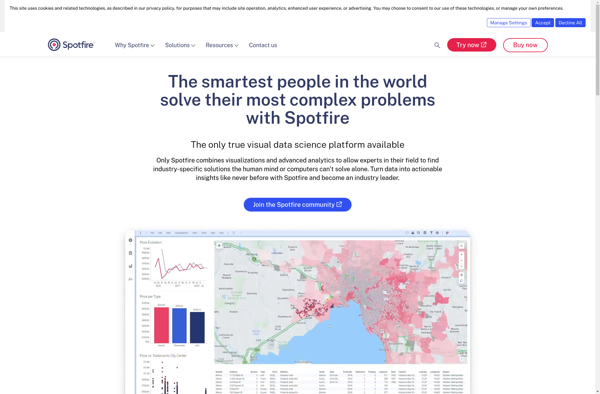
Spotfire
Redash
