Description: Grafana is an open source analytics and monitoring visualization tool. It allows you to query, visualize, alert on and understand metrics from various data sources like Prometheus, Elasticsearch, Graphite, and more. Grafana makes it easy to create dashboards with drilling down capabilities as well as share visualizations with non-technical team members.
Type: software
Pricing: Open Source (self-hosted) and Freemium (Grafana Cloud free tier), with Paid tiers for advanced features and enterprise support
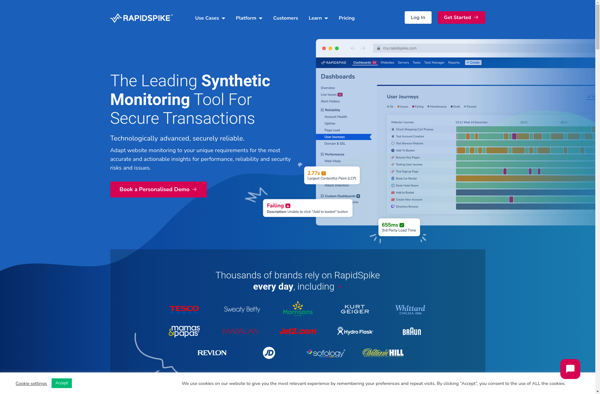
Description: RapidSpike is a load and performance testing tool for web applications. It allows users to simulate hundreds or thousands of concurrent users to test the performance, reliability, and scalability of web apps under heavy load.
Type: software