Description: Grafana is an open source analytics and monitoring visualization tool. It allows you to query, visualize, alert on and understand metrics from various data sources like Prometheus, Elasticsearch, Graphite, and more. Grafana makes it easy to create dashboards with drilling down capabilities as well as share visualizations with non-technical team members.
Type: software
Pricing: Open Source (self-hosted) and Freemium (Grafana Cloud free tier), with Paid tiers for advanced features and enterprise support
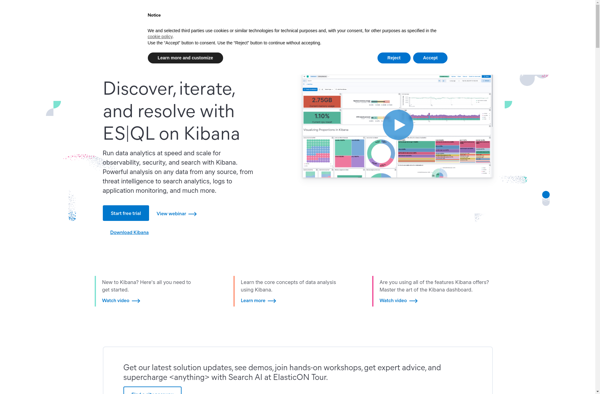
Description: Kibana is an open-source data visualization dashboard for Elasticsearch. It provides visualization capabilities on top of the content indexed on an Elasticsearch cluster. Users can create bar, line and scatter plots, or pie charts and maps on top of large volumes of data.
Type: software
Pricing: Free