Description: Grafana is an open source analytics and monitoring visualization tool. It allows you to query, visualize, alert on and understand metrics from various data sources like Prometheus, Elasticsearch, Graphite, and more. Grafana makes it easy to create dashboards with drilling down capabilities as well as share visualizations with non-technical team members.
Type: software
Pricing: Open Source (self-hosted) and Freemium (Grafana Cloud free tier), with Paid tiers for advanced features and enterprise support
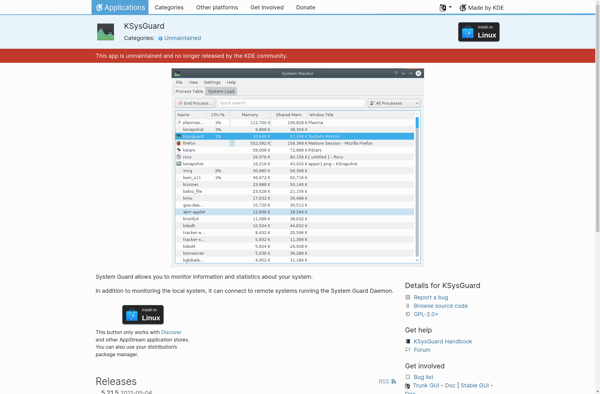
Description: KSysGuard is an advanced system monitoring and process management tool for the KDE desktop environment. It allows users to monitor CPU, memory, network usage, running processes, and other system resources in real time.
Type: software
Pricing: Free