Struggling to choose between DalmatinerDB and Grafana? Both products offer unique advantages, making it a tough decision.
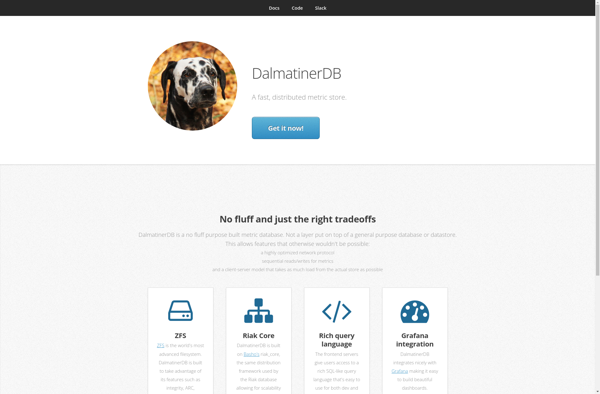
DalmatinerDB is a Development solution with tags like metrics, timeseries, erlang.
It boasts features such as Fast write throughput, Built-in sharding and replication, Query language for analyzing time-series data, HTTP API for writing and querying metrics, Plugins for ingesting data from various sources and pros including Highly scalable and distributed architecture, Very fast writes for time-series data, Erlang runtime provides fault tolerance, Open source with permissive MIT license.
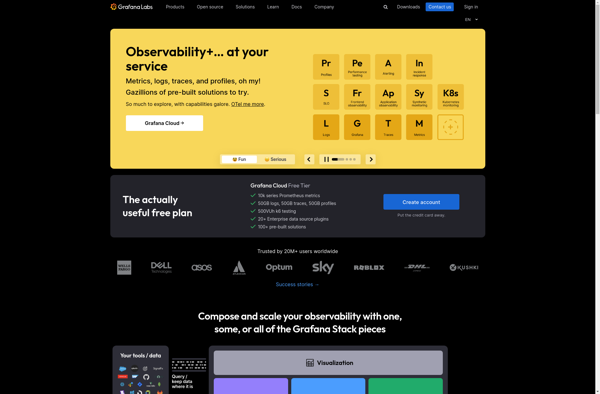
On the other hand, Grafana is a Ai Tools & Services product tagged with analytics, monitoring, visualization, dashboard.
Its standout features include Visualization of time series data, Support for multiple data sources, Annotation and alerting capabilities, Dashboard creation and sharing, Plugin ecosystem for extensibility, and it shines with pros like Open source and free, Powerful and flexible visualization, Wide range of data source integrations, Active community support.
To help you make an informed decision, we've compiled a comprehensive comparison of these two products, delving into their features, pros, cons, pricing, and more. Get ready to explore the nuances that set them apart and determine which one is the perfect fit for your requirements.
DalmatinerDB is a fast, distributed metrics database written in Erlang. It is optimized for storing time-series data like metrics and events. It can handle high volumes of writes with low latency.
Grafana is an open source analytics and monitoring visualization tool. It allows you to query, visualize, alert on and understand metrics from various data sources like Prometheus, Elasticsearch, Graphite, and more. Grafana makes it easy to create dashboards with drilling down capabilities as well as share visualizations with non-technical team members.