Deep.BI is a business intelligence and data visualization platform that allows users to connect to various data sources, build interactive dashboards and reports, and share insights. It features drag-and-drop functionality, custom styling options, scheduled updates, and collabora
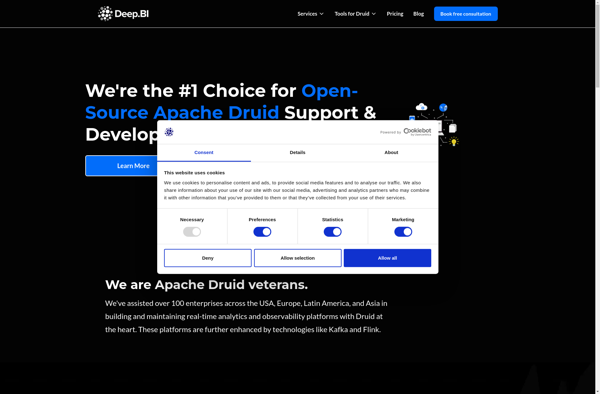
Deep.BI: Business Intelligence & Data Visualization Platform
Connect to various data sources, build interactive dashboards and reports, and share insights with drag-and-drop functionality, custom styling options, scheduled updates, and collaboration tools.
What is Deep.BI?
Deep.BI is a flexible business intelligence and data visualization platform designed to help companies make data-driven decisions. It allows users to connect to a wide variety of data sources including databases, cloud apps, and files to import data.
Once the data is imported, Deep.BI provides an easy drag-and-drop interface to build interactive dashboards and reports that bring data to life with charts, graphs, maps, and more. Users can customize colors, formatting, layouts and even code their own widgets and visualizations for unique needs.
Key features include:
Intuitive drag-and-drop interface to build dashboards and reports quickly
Hundreds of customizable data visualization widgets including tables, charts, graphs, gauges, maps, and more
Exploration tools like filtering, drilling down, sorting, and pivoting to interact with data
Scheduled updates to keep dashboards and reports current
Custom styling, themes, and white labeling options
Collaboration tools to share insights across the organizations
Access controls to manage users and permission levels
APIs and database connectivity to connect with various data sources
Custom SQL and scripting to manipulate data
Deep.BI is suitable for business users, analysts, and developers looking to democratize data, build reports, create interactive dashboards, and enable better data-driven decision making across their organization.
Deep.BI Features
Features
Drag-and-drop interface for building dashboards
Connect to various data sources like SQL, MongoDB, REST APIs
Interactive visualizations like charts, graphs, maps, and pivot tables
Scheduled and real-time data updates
Collaboration tools for sharing dashboards and insights
Custom styling and branding options
Access control and user management
Mobile optimization and offline mode
Pricing
Freemium
Subscription-Based
Pros
Intuitive and easy to use
Great for non-technical users
Affordable pricing
Fast to get started and build dashboards
Integrates with many data sources
Good customization options
Cons
Limited advanced analytics features
Not ideal for large complex datasets
Lacks some enterprise-level capabilities like governance
Google Analytics is a free web analytics service offered by Google that tracks and reports website traffic. It is the most widely used web analytics service on the Internet.Some key features of Google Analytics include:Tracking number of visitors, page views, bounce rate, session duration, demographics, location, behavior and moreIn-depth analysis...
AWStats is a powerful, free and open source log file analyzer for web analytics. It processes log files generated by web, FTP, mail and media servers, and produces customizable reports on website traffic statistics.Some key features of AWStats include:Generates reports on visits, unique visitors, page views, top pages, entry/exit pages,...
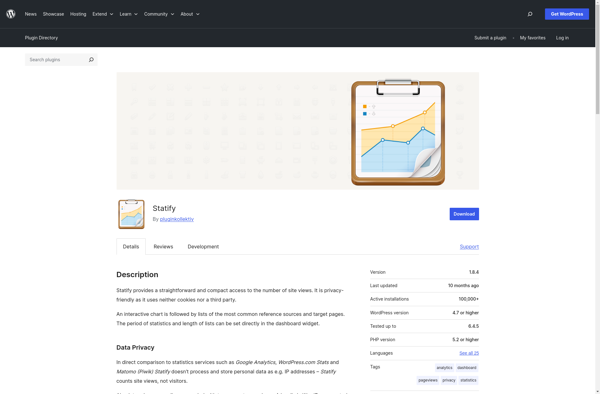
Statify is a user-friendly web analytics platform designed to help website owners, bloggers, and small business owners better understand their website traffic and visitor behavior. Some key features of Statify include:Intuitive dashboards and reports providing actionable insights on website visitors, traffic sources, popular content, and more.Real-time analytics allowing you to...
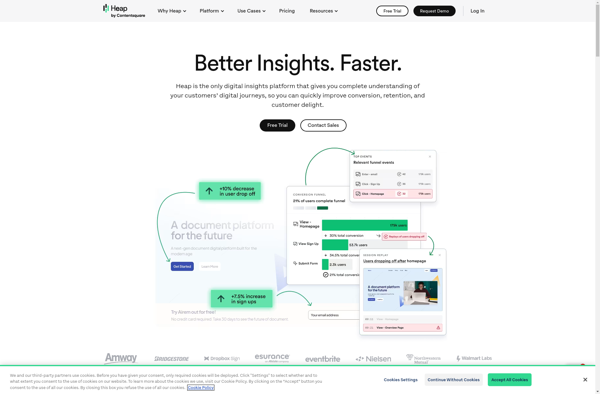
Heap Analytics is a robust user behavior analytics platform designed to help product and growth teams deeply understand how users interact with their digital products. It automatically captures every user action in your web or mobile application, allowing you to measure key metrics like funnels, retention cohorts, sticky features, and...
Whatagraph is a robust yet easy-to-use data visualization and reporting platform suitable for business users of all backgrounds. With an intuitive drag-and-drop interface, anyone can create interactive dashboards, charts, maps, and graphs that automatically update when data changes.Whatagraph connects directly to data sources like MySQL, PostgreSQL, Excel, Google Sheets, and...
Blogely is an easy-to-use blogging platform suitable for beginner to advanced bloggers. It provides an intuitive drag-and-drop interface that allows users to create visually appealing blogs without needing to know any coding. Some key features of Blogely include:Multiple user accounts so you can have separate blogs for personal and business...
Ghostboard is an open-source web-based kanban project management application similar to Trello. It allows teams to organize their work in boards that contain lists of cards representing tasks or items. Some key features of Ghostboard include:Flexible boards, lists, and cards for organizing work any way you wantDrag-and-drop support to easily...
Open Web Analytics (OWA) is an open source web analytics platform that you can use to track and analyze traffic on your websites. It provides a wealth of data to help you understand your visitors and make better decisions about your online marketing and content strategy.Some key features of OWA...
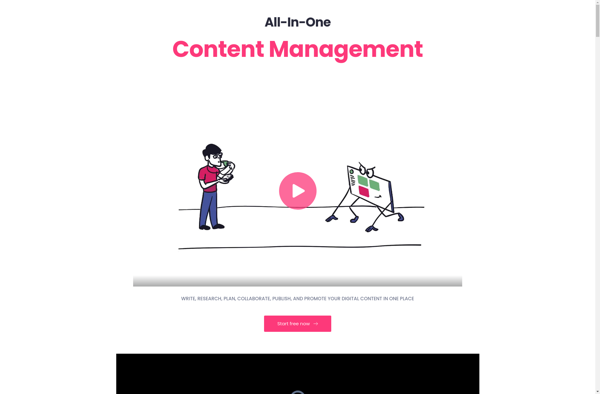
StoryChief.io is a content creation and marketing platform designed to help companies plan, produce, and promote high-quality content efficiently. Its key features include:Content ideation tools like keyword research, competitor analysis, and an idea generator to come up with fresh content conceptsAn editorial calendar planner to map out content across channels...
IO Technologies is a privately-held software company founded in 2008 and headquartered in San Francisco. They focus on providing automation software, platforms, and tools to help other companies and organizations digitize, streamline, and optimize their business workflows, operations, and processes.Their main product is the IO Automation Platform, an enterprise-grade solution...
Calq is a spreadsheet and data analysis software built as an alternative to Excel. Its key features and benefits include:Intuitive spreadsheet interface for entering, formatting and calculating dataTools for quick data collection from forms, surveys, and other sourcesOver 400 functions for statistical analysis, finance, math, engineering, science and moreAI-powered features...