Deep.BI
Description: Deep.BI is a business intelligence and data visualization platform that allows users to connect to various data sources, build interactive dashboards and reports, and share insights. It features drag-and-drop functionality, custom styling options, scheduled updates, and collaboration tools.
Type: software
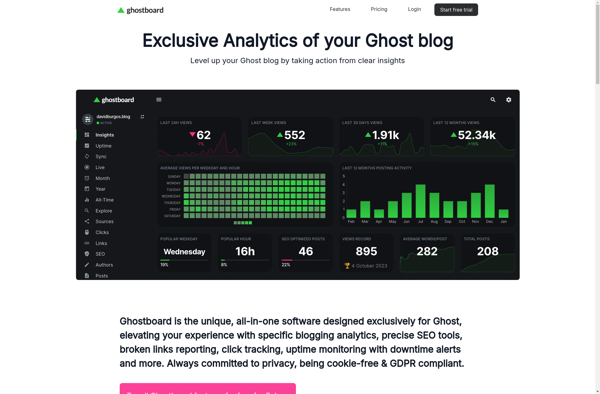
Ghostboard
Description: Ghostboard is an open-source alternative to Trello for kanban project management. It allows users to create boards, lists, and cards to organize tasks and projects in a flexible way, with features like drag-and-drop, attachments, due dates, and more.
Type: software
Pricing: Open Source