Analytics Portfolio
Analytics Portfolio: Business Intelligence & Analytics Platform
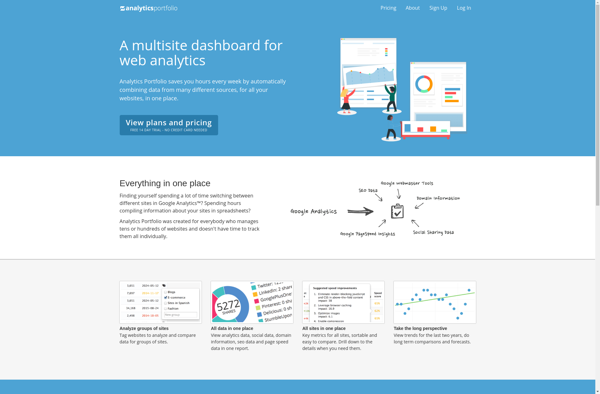
Analytics Portfolio is a business intelligence and analytics platform that allows users to create interactive dashboards and reports to gain insights into their data. It includes data visualization features, self-service analytics, and collaboration tools.
What is Analytics Portfolio?
Analytics Portfolio is a flexible business intelligence and analytics solution designed to help companies of all sizes gain deeper insights from their data. Some key features and benefits of Analytics Portfolio include:
- Interactive dashboards and reports - Users can create customized dashboards with drag-and-drop simplicity to visualize key metrics and KPIs. The platform includes a variety of out-of-the-box widgets and chart types.
- Self-service analytics - Non-technical users can easily access, prepare, and analyze data without relying on IT resources. Analytics Portfolio enables self-service BI with intuitive data modeling and visualization capabilities.
- Collaboration and sharing - Dashboards, reports, and insights can be securely shared across the organizations. Users can add commentary and annotate visualizations to share insights.
- Data connectivity and ETL - Analytics Portfolio comes with pre-built connectors for common data sources. It also includes self-service data preparation and ETL capabilities allow blending of multiple data sources.
- Mobile analytics - Users can access dashboards and reports via mobile apps. Responsive design allows consumption on any device.
- Embedded analytics - Analytics capabilities can be embedded into custom applications to deliver insights within business workflows.
With an intuitive interface, customizable dashboards, and self-service analytics, Analytics Portfolio enables companies to create a data-driven culture for faster and better decision making.
Analytics Portfolio Features
Features
- Drag-and-drop interface to build dashboards
- Pre-built dashboard templates
- Interactive data visualizations (charts, graphs, gauges, maps, etc.)
- Ad-hoc reporting and analysis
- Data blending from multiple sources
- Scheduled and automated report distribution
- Access controls and sharing
- Mobile app for viewing dashboards on the go
- Integration with BI tools like Tableau, Qlik, etc.
- Collaboration tools like discussions, annotations, etc.
Pricing
- Freemium
- Subscription-Based
Pros
Cons
Official Links
Reviews & Ratings
Login to ReviewThe Best Analytics Portfolio Alternatives
View all Analytics Portfolio alternatives with detailed comparison →
Top Business & Commerce and Business Intelligence & Analytics and other similar apps like Analytics Portfolio
Here are some alternatives to Analytics Portfolio:
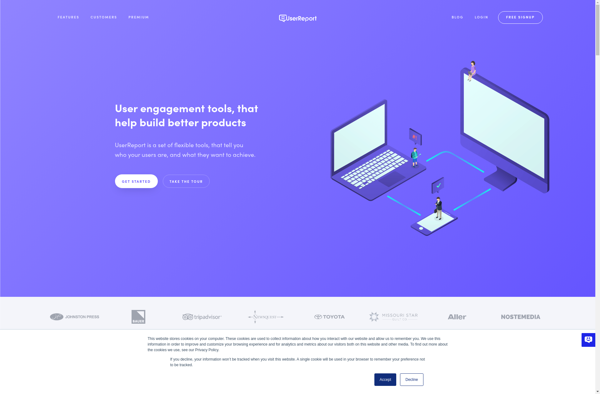
Suggest an alternative ❐UserReport
Whatagraph

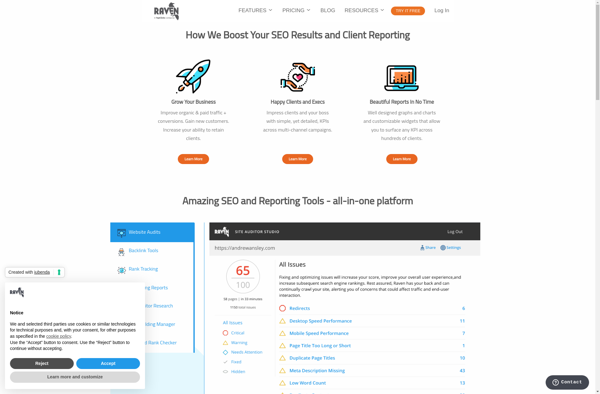
Raven Tools
Windward Dash