KPIBees is a business intelligence and data visualization software that allows users to track key performance indicators (KPIs) and create interactive dashboards. It integrates with various data sources to extract insights.
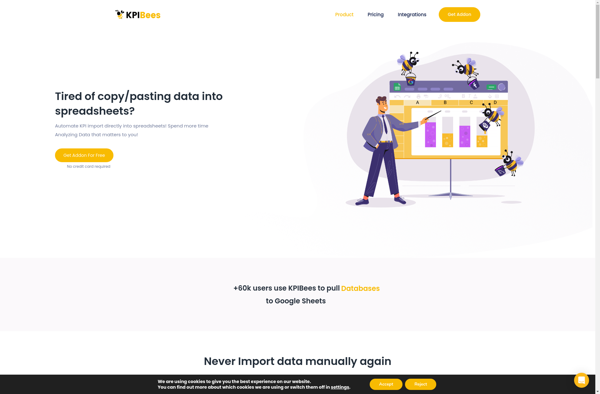
KPIBees: Business Intelligence & Data Visualization Software
Track KPIs, create interactive dashboards, and visualize data with KPIBees, a powerful business intelligence tool integrating with multiple data sources.
What is KPIBees?
KPIBees is a flexible business intelligence and data visualization platform used by organizations to monitor key performance indicators (KPIs). It provides an easy way to connect various data sources, create customized dashboards with charts/graphs, and share actionable insights across teams.
Some key features of KPIBees include:
Intuitive drag-and-drop interface to build interactive dashboards without coding
Options to create different types of charts and metrics cards to track KPIs
Ability to connect to data sources like MySQL, PostgreSQL, Salesforce, Excel, etc. for real-time data analytics
Scheduled reports and alerts to proactively notify teams when KPI targets are not met
Robust collaboration tools to discuss insights and annotate directly on dashboards
Role-based access control to ensure security and data governance
APIs and integrations with BI tools like Tableau, Power BI, and web/mobile apps
Options to white-label and customize dashboards for branding purposes
With an easy-to-use interface and comprehensive features, KPIBees is trusted by companies across industries like healthcare, finance, marketing, sales, etc. to democratize data and help teams gain strategic visibility for improved decision making.
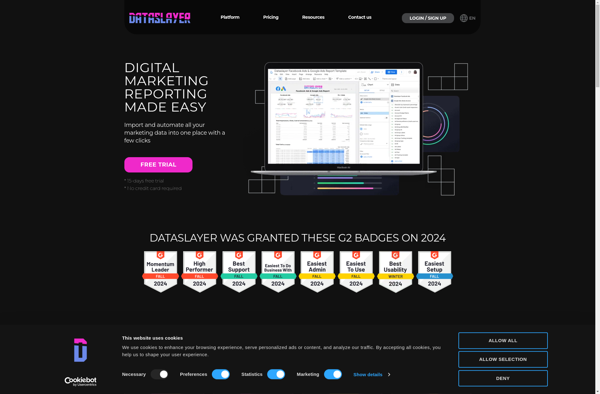
Dataslayer.ai is an end-to-end artificial intelligence (AI) powered data preparation and data management platform designed to help organizations get more value from their data. It provides capabilities across the full data lifecycle including:Data Discovery - Automatically crawl data sources like databases, data warehouses, file shares and more to create a...
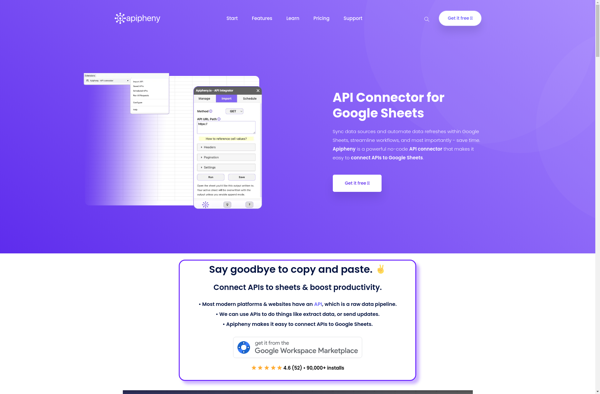
Apipheny is an end-to-end API management platform designed to help teams build, manage, and analyze APIs more efficiently. Some key features of Apipheny include:Visual API Designer: Allows you to design APIs visually by dragging and dropping components instead of coding.Mocking: Auto-generates mock servers and mocked API responses for faster testing.Documentation:...
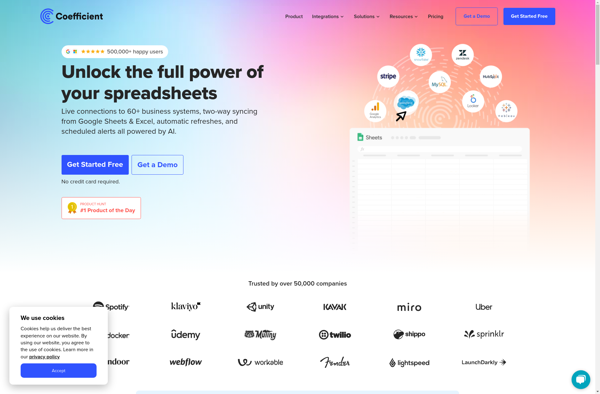
Coefficient is a cloud-based virtual office platform designed for remote and distributed teams. It combines popular workplace tools like video conferencing, chat, calendars, documents, and task management into one unified easy-to-use workspace.Key features of Coefficient include:HD video meetings - Face-to-face interactions with screen sharing, reactions, and virtual backgroundsTeam chat -...
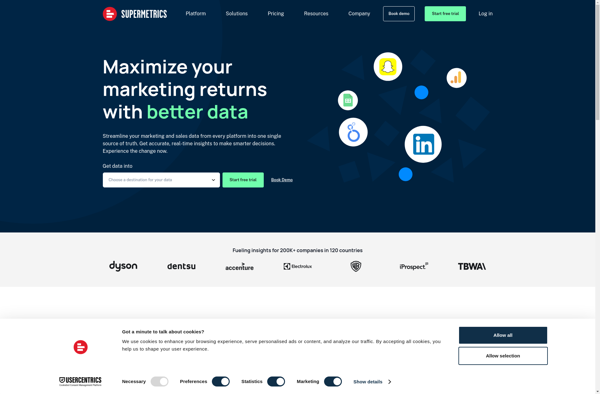
Supermetrics is a powerful marketing analytics software that allows users to connect, analyze and visualize data from a wide variety of sources. It serves as a centralized platform to manage all your marketing data in one place.With Supermetrics, you can connect data sources such as:Google AnalyticsFacebook AdsAdWordsYouTubeLinkedInTwitterMicrosoft AdvertisingSalesforceStripeAnd many moreSome...
Whatagraph is a robust yet easy-to-use data visualization and reporting platform suitable for business users of all backgrounds. With an intuitive drag-and-drop interface, anyone can create interactive dashboards, charts, maps, and graphs that automatically update when data changes.Whatagraph connects directly to data sources like MySQL, PostgreSQL, Excel, Google Sheets, and...
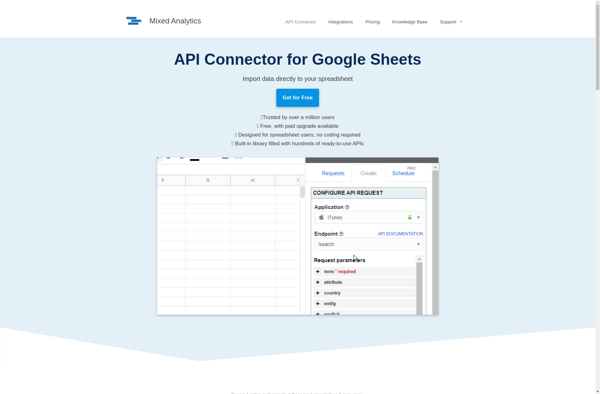
API Connector is an integration middleware tool that enables applications to seamlessly connect with and leverage the capabilities of external APIs. It provides a centralized interface to manage API connections, handle authentication, transform data into the required format, map between the application's data model and the API, combine data from...
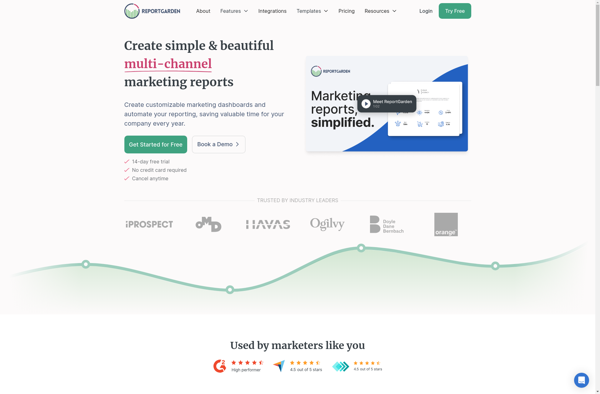
Reportgarden is a business intelligence and data visualization platform designed to help companies make data-driven decisions. It allows users to connect and combine data from multiple sources, including databases, cloud apps, and Excel files, into one centralized location.Some key features of Reportgarden include:Interactive dashboards - Build customizable dashboards with drag-and-drop...
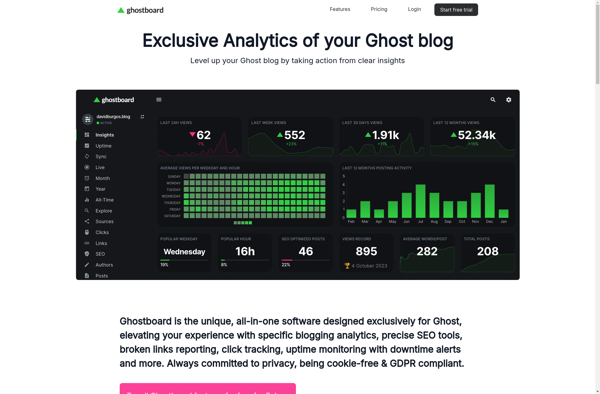
Ghostboard is an open-source web-based kanban project management application similar to Trello. It allows teams to organize their work in boards that contain lists of cards representing tasks or items. Some key features of Ghostboard include:Flexible boards, lists, and cards for organizing work any way you wantDrag-and-drop support to easily...
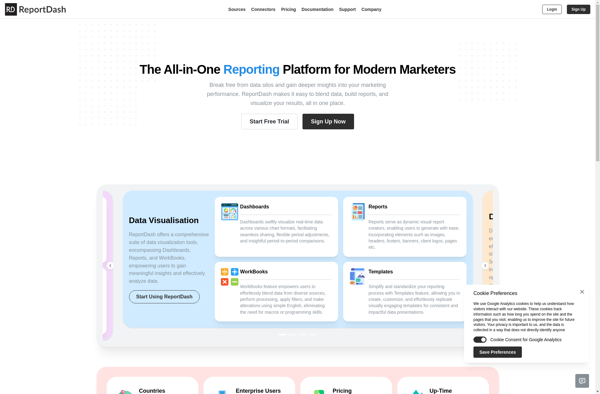
ReportDash is a versatile business intelligence and analytics platform suitable for companies of all sizes. It allows users to connect to various data sources, clean and transform data, and create interactive reports and dashboards that provide actionable insights.Key features include:Intuitive drag-and-drop interface to build reports and dashboards quicklyVariety of customizable...
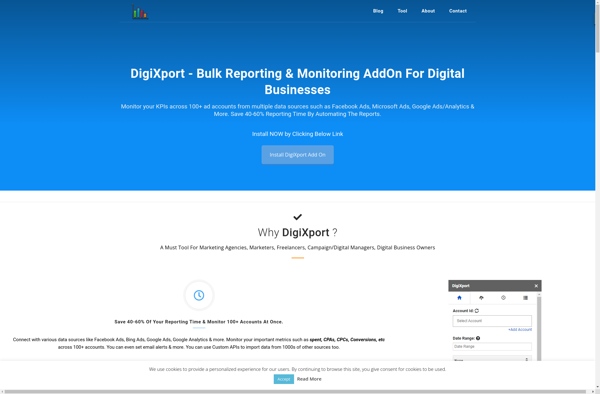
DigiXport is a robust digital asset management (DAM) platform designed for organizing, managing, and distributing digital media assets like images, videos, audio, documents, and more. It serves as a centralized media library with powerful search, automation, and collaboration tools to help teams streamline workflows.Key features of DigiXport include:Intelligent auto-tagging and...