CircleBi
Description: CircleBI is a business intelligence and analytics platform that provides dashboards, reports, and visualizations to help companies analyze data and make better decisions. It integrates with various data sources and allows easy data exploration.
Type: software
Cyfe
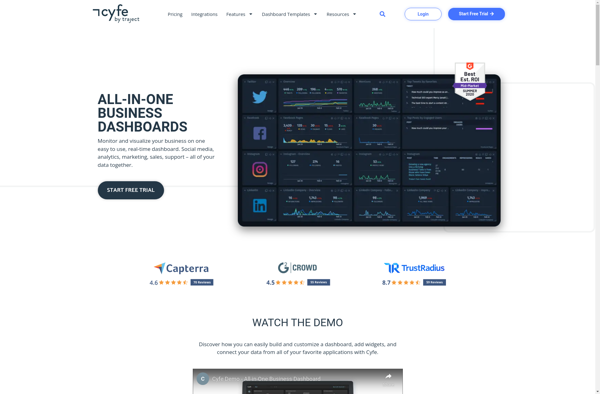
Description: Cyfe is an all-in-one online business dashboard that allows you to monitor and analyze key business metrics from various services in one centralized location. It integrates with popular tools like Salesforce, QuickBooks, Google Analytics, and more to give you visibility across your entire business.
Type: software