datapine
Description: Datapine is an easy-to-use business analytics and dashboard software that allows businesses to visualize and analyze data to gain insights and make better decisions. It helps connect data sources, create interactive dashboards, charts and maps, and collaborate across teams.
Type: software
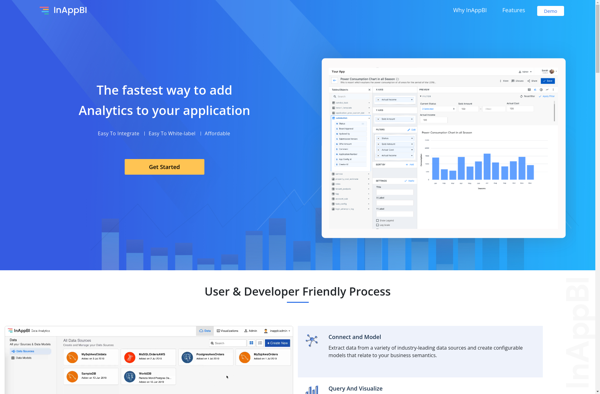
InAppBI
Description: InAppBI is a business intelligence and analytics platform designed for use within web and mobile applications. It allows developers to build custom analytics dashboards and reports that provide insights into app usage and customer behavior.
Type: software