datapine
Description: Datapine is an easy-to-use business analytics and dashboard software that allows businesses to visualize and analyze data to gain insights and make better decisions. It helps connect data sources, create interactive dashboards, charts and maps, and collaborate across teams.
Type: software
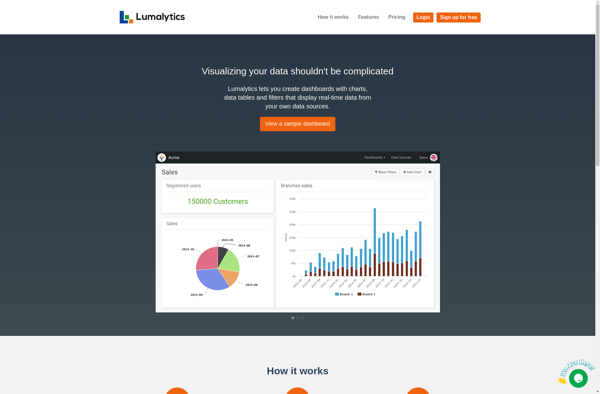
Lumalytics
Description: Lumalytics is a cloud-based analytics platform designed specifically for logistic companies. It provides real-time visibility into shipment tracking, carrier performance, and other key logistics metrics. Lumalytics aims to help logistics companies make data-driven decisions to improve efficiency.
Type: software