datapine
Description: Datapine is an easy-to-use business analytics and dashboard software that allows businesses to visualize and analyze data to gain insights and make better decisions. It helps connect data sources, create interactive dashboards, charts and maps, and collaborate across teams.
Type: software
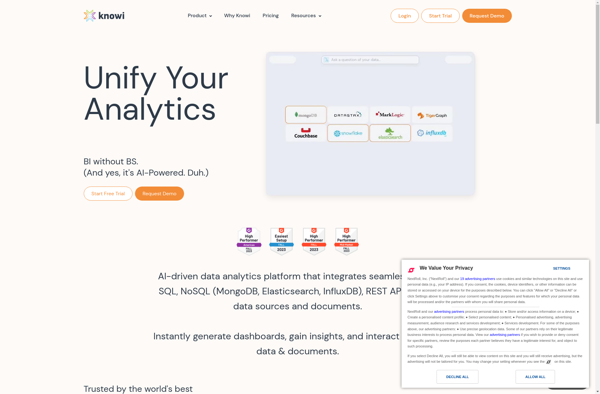
Knowi
Description: Knowi is a business intelligence and analytics platform that allows users to easily visualize data and create interactive dashboards. It has drag-and-drop functionality to build reports and charts without coding.
Type: software