Struggling to choose between Grafana Loki and LogLogic? Both products offer unique advantages, making it a tough decision.
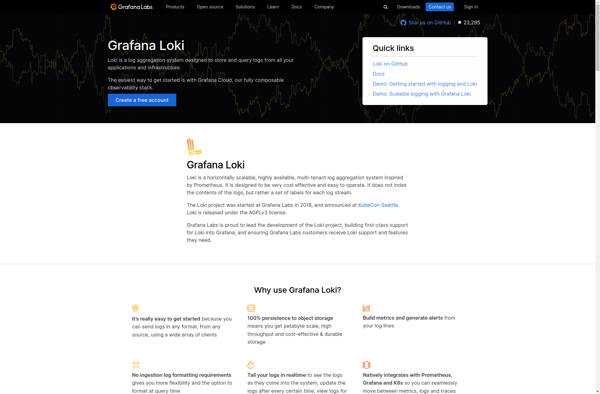
Grafana Loki is a Monitoring & Observability solution with tags like logs, monitoring, observability.
It boasts features such as Log aggregation system, Optimized for querying logs, Uses labels to organize log streams, Integrates with Grafana for visualizations and pros including Open source and free, Scales horizontally, Fast queries, Integrated with Grafana ecosystem.
On the other hand, LogLogic is a Network & Admin product tagged with logging, monitoring, analysis, security.
Its standout features include Real-time log monitoring and alerting, Log collection and aggregation from across infrastructure, Advanced log search and filtering, Customizable dashboards and reporting, Log archiving and compliance, Anomaly detection and behavioral analytics, Integration with SIEM and other security tools, and it shines with pros like Powerful log management and analysis capabilities, Scales to handle large log volumes, Intuitive and easy to use interface, Advanced analytics and machine learning options, Broad support for log sources and integration capabilities, Cloud-based SaaS delivery model.
To help you make an informed decision, we've compiled a comprehensive comparison of these two products, delving into their features, pros, cons, pricing, and more. Get ready to explore the nuances that set them apart and determine which one is the perfect fit for your requirements.
Grafana Loki is an open source logging aggregation system designed to be part of the Grafana ecosystem. It is optimized for saving, indexing, and querying logs through labels and streams.
LogLogic is a log management and analysis platform that aggregates log data from across an organization's IT infrastructure. It provides real-time monitoring, historical analysis, search and alerting capabilities to help organizations detect threats, troubleshoot issues and gain insights.