Hosted Graphite vs Icinga

Struggling to choose between Hosted Graphite and Icinga? Both products offer unique advantages, making it a tough decision.

Hosted Graphite is a Online Services solution with tags like metrics, monitoring, visualization, timeseries, dashboard.

It boasts features such as Real-time graphing and dashboarding, Alerting and anomaly detection, Metrics storage and retention policies, REST API for automation and integration, Role-based access control and permissions, White-labeling and branding options and pros including Easy to set up and use, Scalable and reliable data collection, Pre-built integrations and plugins, Customizable dashboards and graphs, Available as SaaS or self-hosted.

On the other hand, Icinga is a Network & Admin product tagged with monitoring, alerting, reporting.

Its standout features include Real-time monitoring, Alerting and notifications, Automated service checks, Plugin architecture, Web interface, REST API, Distributed monitoring, Reporting, Visualization, Auto-discovery, Configuration management, Clustering, High availability, and it shines with pros like Open source, Flexible and extensible, Wide range of plugins, Scalable, Good community support, Integrates with other tools, Customizable dashboards, Good documentation.

To help you make an informed decision, we've compiled a comprehensive comparison of these two products, delving into their features, pros, cons, pricing, and more. Get ready to explore the nuances that set them apart and determine which one is the perfect fit for your requirements.

Hosted Graphite

Hosted Graphite

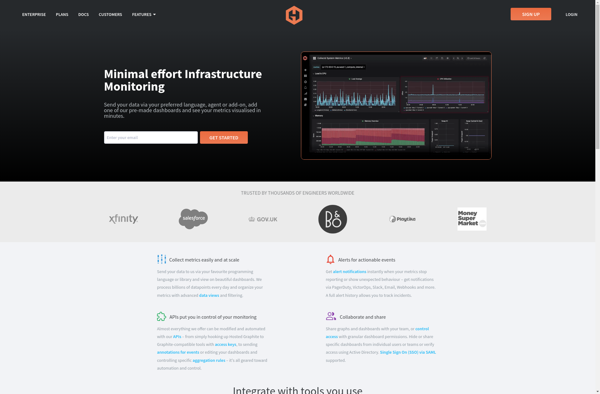
Hosted Graphite is a cloud-based monitoring tool for analyzing time-series metrics and data. It offers real-time graphing, dashboarding, alerts, and anomaly detection for observability of applications and infrastructure.

Categories:
metrics monitoring visualization timeseries dashboard

Hosted Graphite Features

  1. Real-time graphing and dashboarding
  2. Alerting and anomaly detection
  3. Metrics storage and retention policies
  4. REST API for automation and integration
  5. Role-based access control and permissions
  6. White-labeling and branding options

Pricing

  • Free
  • Freemium
  • Subscription-Based

Pros

Easy to set up and use

Scalable and reliable data collection

Pre-built integrations and plugins

Customizable dashboards and graphs

Available as SaaS or self-hosted

Cons

Can get expensive at higher tiers

Limited customization compared to open source

Third-party dependency for critical monitoring

Requires some expertise to get most value


Icinga

Icinga

Icinga is an open source IT monitoring tool used to monitor network services, servers, applications, and business processes. It can send notifications about issues and outages, as well as generate reports on infrastructure performance.

Categories:
monitoring alerting reporting

Icinga Features

  1. Real-time monitoring
  2. Alerting and notifications
  3. Automated service checks
  4. Plugin architecture
  5. Web interface
  6. REST API
  7. Distributed monitoring
  8. Reporting
  9. Visualization
  10. Auto-discovery
  11. Configuration management
  12. Clustering
  13. High availability

Pricing

  • Open Source

Pros

Open source

Flexible and extensible

Wide range of plugins

Scalable

Good community support

Integrates with other tools

Customizable dashboards

Good documentation

Cons

Complex setup and configuration

Steep learning curve

Limited native Windows monitoring

No built-in log monitoring

Limited native cloud monitoring