Munin vs Cacti

Struggling to choose between Munin and Cacti? Both products offer unique advantages, making it a tough decision.

Munin is a System & Hardware solution with tags like resource-monitoring, performance, trends, graphs, visualization.

It boasts features such as Monitoring of system resource usage and performance, Automatic detection of new devices on the network, Configurable alerts and notifications, Graphing and visualization of monitored metrics, Support for monitoring multiple servers and devices, Plugin architecture for monitoring custom metrics, Web-based interface for viewing monitoring data and pros including Free and open source, Easy to install and configure, Scales to monitor many servers, Customizable plugins and alerts, Intuitive web interface, Minimal impact on system performance.

On the other hand, Cacti is a Network & Admin product tagged with network, monitoring, graphing, statistics.

Its standout features include Graphing and monitoring tool for network devices, Supports SNMP polling for data collection, Customizable graphs and dashboards, Threshold-based alerting, Supports RRDTool for data storage, Web-based interface, Plugin architecture for extendibility, and it shines with pros like Free and open source, Easy to install and configure, Wide range of supported devices, Flexible and customizable, Active community support.

To help you make an informed decision, we've compiled a comprehensive comparison of these two products, delving into their features, pros, cons, pricing, and more. Get ready to explore the nuances that set them apart and determine which one is the perfect fit for your requirements.

Munin

Munin

Munin is an open-source resource monitoring tool that tracks resource usage and trends on computers and networks. It generates graphs that visualize resource utilization over time and helps identify performance or capacity issues.

Categories:
resource-monitoring performance trends graphs visualization

Munin Features

  1. Monitoring of system resource usage and performance
  2. Automatic detection of new devices on the network
  3. Configurable alerts and notifications
  4. Graphing and visualization of monitored metrics
  5. Support for monitoring multiple servers and devices
  6. Plugin architecture for monitoring custom metrics
  7. Web-based interface for viewing monitoring data

Pricing

  • Open Source

Pros

Free and open source

Easy to install and configure

Scales to monitor many servers

Customizable plugins and alerts

Intuitive web interface

Minimal impact on system performance

Cons

Limited native support for Windows

Steeper learning curve than some tools

Plugins can be tricky to develop

No native support for monitoring virtual/cloud environments

Web interface is a bit dated


Cacti

Cacti

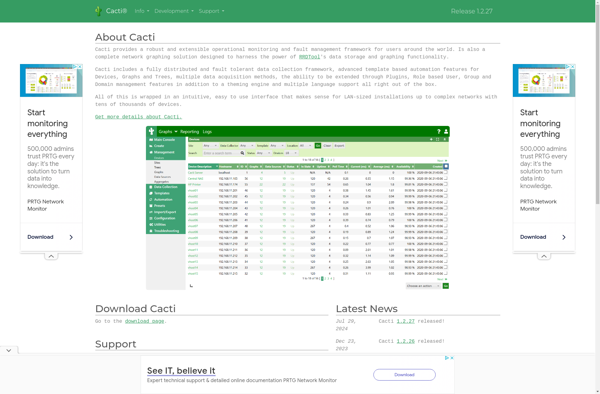
Cacti is an open-source network monitoring and graphing tool that provides easy monitoring of network devices and servers. It polls devices for utilization data, stores the data, and generates graphs and statistics to help analyze network traffic and utilization.

Categories:
network monitoring graphing statistics

Cacti Features

  1. Graphing and monitoring tool for network devices
  2. Supports SNMP polling for data collection
  3. Customizable graphs and dashboards
  4. Threshold-based alerting
  5. Supports RRDTool for data storage
  6. Web-based interface
  7. Plugin architecture for extendibility

Pricing

  • Open Source

Pros

Free and open source

Easy to install and configure

Wide range of supported devices

Flexible and customizable

Active community support

Cons

Steep learning curve

Complex interface

Manual configuration required

Limited scalability

No official support