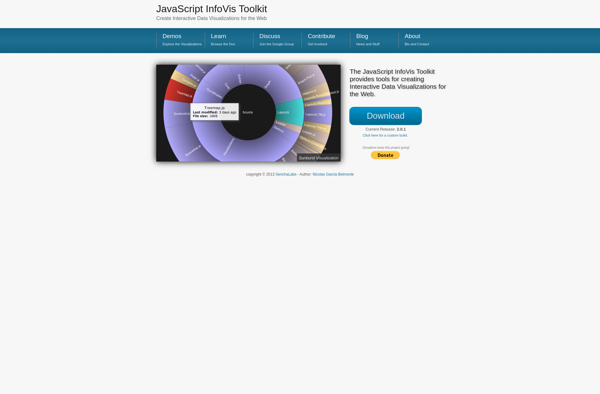
JavaScript InfoVis Toolkit
Description: The JavaScript InfoVis Toolkit is an open-source JavaScript library for creating interactive data visualizations for the web. It provides tools for charts, graphs, diagrams, and other visual representations of complex data.
Type: software
Pricing: Open Source
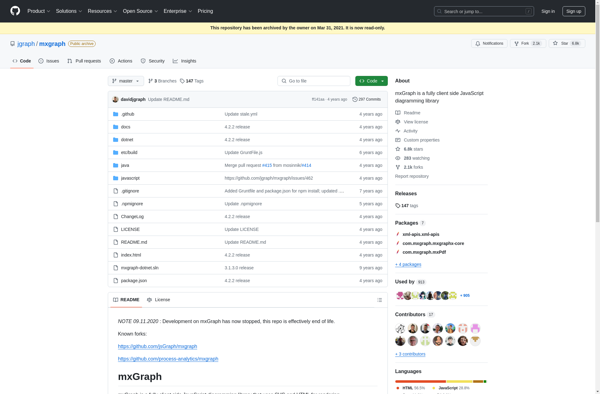
mxGraph
Description: mxGraph is an open-source JavaScript diagramming library that allows developers to add diagram and charting capabilities to web applications. It supports various diagram types like flowcharts, org charts, ER diagrams, UML, networks and more.
Type: software
Pricing: Open Source