JavaScript InfoVis Toolkit
JavaScript InfoVis Toolkit: Open-Source Visualization Library
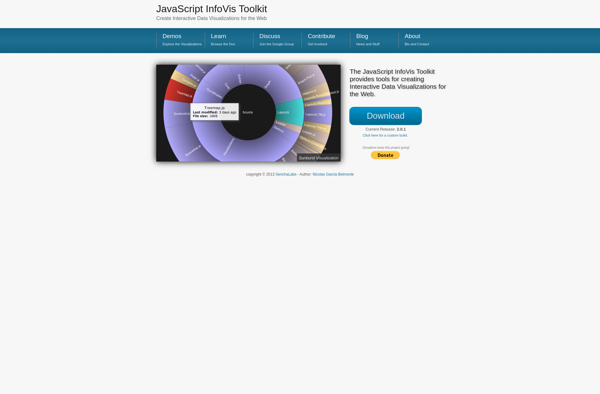
The JavaScript InfoVis Toolkit is an open-source JavaScript library for creating interactive data visualizations for the web. It provides tools for charts, graphs, diagrams, and other visual representations of complex data.
What is JavaScript InfoVis Toolkit?
The JavaScript InfoVis Toolkit is an open-source JavaScript library for creating interactive data visualizations for the web. Developed by Sencha Inc., it provides a set of tools for building a wide range of charts, graphs, diagrams, and other visual representations of complex data sets.
Some key features of the JavaScript InfoVis Toolkit include:
- Supports various chart types like bar charts, pie charts, force directed graphs, and tree maps
- Includes utilities for data management like sorting, filtering, grouping, and aggregation
- Animations and interactive features for charts
- Graph analysis algorithms and layout engines
- Compatible with major JavaScript libraries like jQuery, Prototype, etc.
- Customizable with theming, styles, and skins
- Client-side data visualization without needing a plugin
The JavaScript InfoVis Toolkit allows developers to avoid flashy yet data-weak visualizations. Instead it focuses on meaningful representations that give better insight into complex data. It scales well across device sizes and has good browser compatibility. The library is free to use and open source.
JavaScript InfoVis Toolkit Features
Features
- Provides tools for creating interactive data visualizations
- Supports various chart types like bar charts, pie charts, scatter plots, etc
- Built on HTML5 Canvas and SVG
- Uses JSON data format
- Modular architecture allows combining components
- Open source library available under MIT license
Pricing
- Open Source
Pros
Cons
Official Links
Reviews & Ratings
Login to ReviewNo reviews yet
Be the first to share your experience with JavaScript InfoVis Toolkit!
Login to ReviewThe Best JavaScript InfoVis Toolkit Alternatives
View all JavaScript InfoVis Toolkit alternatives with detailed comparison →
Top Development and Javascript Libraries and other similar apps like JavaScript InfoVis Toolkit
Here are some alternatives to JavaScript InfoVis Toolkit:
Suggest an alternative ❐GoJS
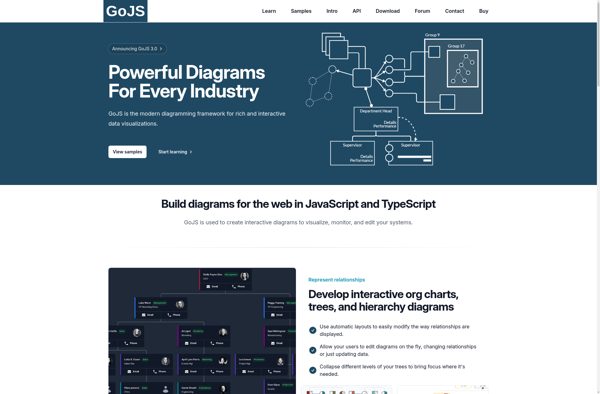
JointJS
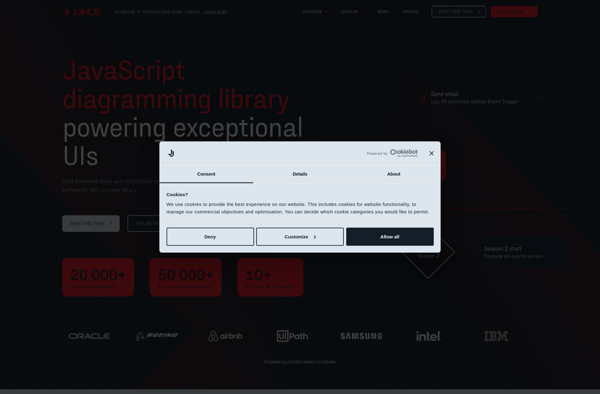
MxGraph
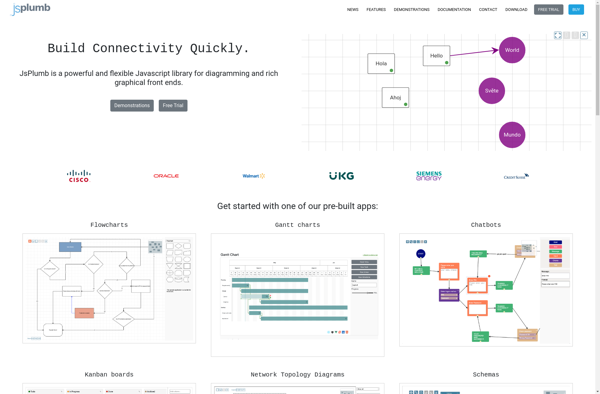
JsPlumb - JS Visualisation Library
Draw2D