Draw2D is an open source JavaScript vector graphics and diagramming library for web applications. It provides functionality for creating and manipulating vector graphics, shapes, graphs, charts, and diagrams in the browser.
Draw2D: Open Source JavaScript Vector Graphics Library
Open source JavaScript vector graphics and diagramming library for web applications, providing functionality for creating and manipulating vector graphics, shapes, graphs, charts, and diagrams in the browser.
What is Draw2D?
Draw2D is an open source JavaScript library for creating vector graphics, diagrams, charts, and graphical editors in web applications. It is built on HTML5 canvas and provides a rich API for generating and manipulating 2D shapes and diagrams.
Some key features of Draw2D include:
Vector graphic primitives like lines, circles, rectangles, etc.
Advanced shapes like diamonds, rounded rectangles, arrows, etc.
Text and font handling
Grouping, transformation, and styling of shapes
Connection anchors and lines for building diagrams and graphs
Automatic layout algorithms for arranging diagram elements
Support for touch devices and gestures
Serializing and deserializing graphics to JSON or SVG
Extensibility through custom shapes, decorators, policy classes etc.
Draw2D makes it easy to build interactive diagramming apps, graphical editors, charting tools, and other data visualization web apps that require vector graphics. It has a modular architecture and is highly customizable.
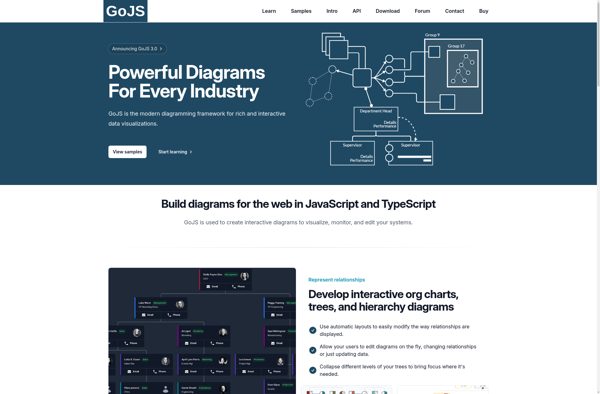
What Is GoJS?GoJS is a commercial JavaScript library for building interactive diagrams, charts, and graphs in web applications. It handles the rendering, layout, and user interaction for complex visual structures like flowcharts, org charts, BPMN diagrams, network topologies, and more.Key FeaturesGoJS provides automatic layout algorithms (tree, force-directed, layered, circular), data...
What Is JointJS?JointJS is an open-source JavaScript diagramming library for creating interactive diagrams and visualizations in web applications. It uses SVG rendering, making diagrams styleable with CSS and easily integrated into modern web frameworks.Key FeaturesJointJS provides a rich set of built-in shapes, connectors, and interactive elements including ports, anchors, and...
Paper.js is an open-source vector graphics scripting framework that runs on top of the HTML5 Canvas element. It provides developers and designers high-performance tools for animation, visualizations, games, and more.Some key capabilities and features of Paper.js include:Vector graphics rendering with WebGL hardware accelerationIntuitive scene graph and hierarchical transformations systemMath utilities...
FabricJS is an open-source JavaScript library that makes it easy to work with HTML5 canvas elements. It provides an object model on top of the canvas that allows you to manipulate shapes, objects and annotations on a canvas using a simple API.Some key features of FabricJS include:Object creation - It...
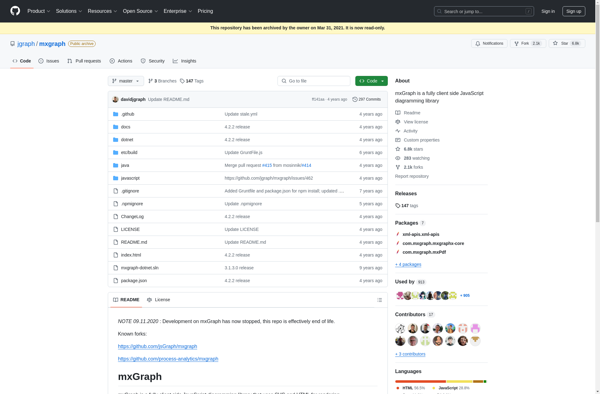
mxGraph is an open-source JavaScript diagramming library that allows developers to add advanced diagram and charting capabilities to web applications. It is highly customizable and supports various diagram types like flowcharts, org charts, ER diagrams, UML diagrams, network diagrams, BPMN and more.Some key features of mxGraph include:Works with modern web...
JsDiagram is an open-source JavaScript library for creating interactive diagrams and charts in web applications. Developed by JSDraw.io, it provides a complete set of drawing tools and shape libraries to help developers visualize and present data in an intuitive way.Some key features of JsDiagram include:Support for flowcharts, UML diagrams, BPMN,...
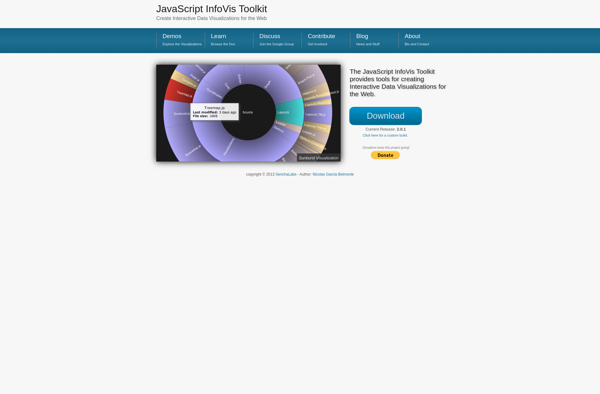
The JavaScript InfoVis Toolkit is an open-source JavaScript library for creating interactive data visualizations for the web. Developed by Sencha Inc., it provides a set of tools for building a wide range of charts, graphs, diagrams, and other visual representations of complex data sets.Some key features of the JavaScript InfoVis...
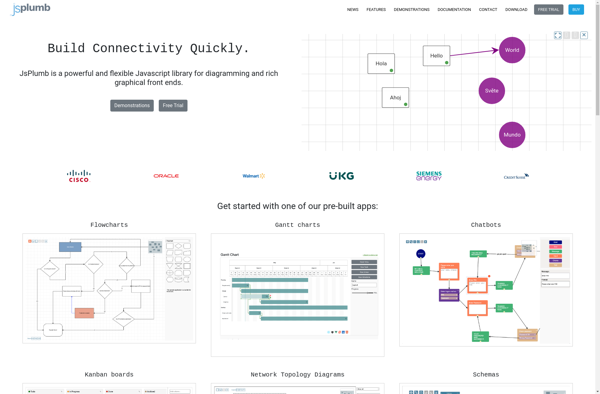
jsPlumb is an open-source JavaScript library for connecting and visualizing elements in a web interface. It provides a range of tools for creating diagrams, flowcharts, directed graphs, visual mapping and more.Some key features of jsPlumb include:Automatic drawing and adjusting of Bezier curves or straight line connectionsSupport for drag-and-drop connectivity between...
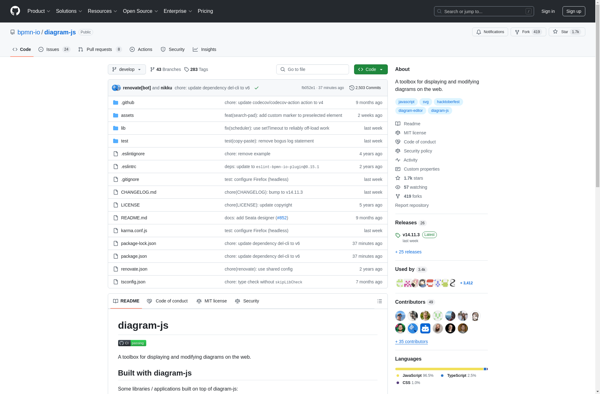
Diagram-JS is an open-source JavaScript library for creating flowcharts, BPMN diagrams, network diagrams, uml diagrams, entity relationship diagrams, and more. It provides a full-featured diagramming solution that runs in the browser.Some key features of Diagram-JS:Customizable canvas with panning, zooming, and scrollingExtensible through custom shapes, connectors, and featuresSupports touch devices and...
KonvaJS is an open source HTML5 canvas JavaScript framework for building high performance user interfaces and graphics. It allows developers to create animations, transitions, nesting, layering, filtering, caching, event handling etc. with high performance even on mobile devices.Some key features of KonvaJS:Lightweight - Only ~80kb gzippedFast rendering and animation with...