Diagram-JS
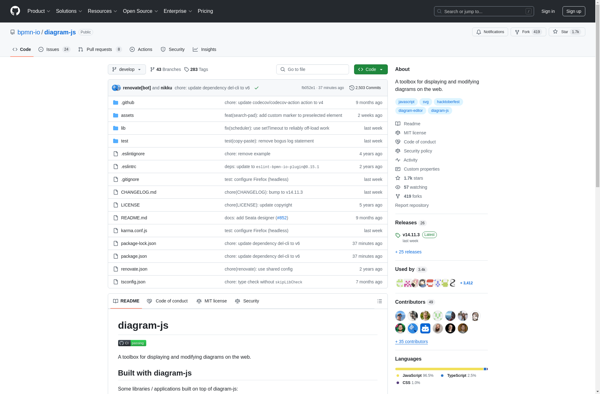
Diagram-JS: Open-Source JavaScript Diagramming Library
Create flowcharts, network diagrams, BPMN diagrams, ER diagrams, UML diagrams, and more with a customizable canvas and diagramming components.
What is Diagram-JS?
Diagram-JS is an open-source JavaScript library for creating flowcharts, BPMN diagrams, network diagrams, uml diagrams, entity relationship diagrams, and more. It provides a full-featured diagramming solution that runs in the browser.
Some key features of Diagram-JS:
- Customizable canvas with panning, zooming, and scrolling
- Extensible through custom shapes, connectors, and features
- Supports touch devices and gestures
- Collaborative editing capabilities
- Import/export to XML, PNG, JPEG formats
- Programmatic access to diagrams from code
- Open architecture that allows extension through plugins
Diagram-JS aims to be a flexible building block for web-based diagramming apps. It was built with modularity, extensibility, and customizability as key priorities. The library handles low-level SVG rendering and events, while exposing hooks for implementing custom diagram types, editing modes, features like copy and paste, keyboard shortcuts, minimap, collab editing, and more.
Diagram-JS is used by several popular tools including DrawIO/Diagrams.net, Uber's re:Architect, and the Signavio Process Editor. It's a proven, full-featured diagramming solution suitable for inclusion in other web apps.
Diagram-JS Features
Features
- Canvas component for rendering diagrams
- Extensible through custom shapes and plugins
- Supports BPMN, flowcharts, ER diagrams, UML diagrams
- Drag and drop diagramming
- Connectors, ports, docking
- Undo/redo, copy/paste, delete
- Keyboard shortcuts
- Zooming and panning
- Cross-browser support
Pricing
- Open Source
Pros
Cons
Official Links
Reviews & Ratings
Login to ReviewThe Best Diagram-JS Alternatives
View all Diagram-JS alternatives with detailed comparison →
Top Development and Diagramming and other similar apps like Diagram-JS
Here are some alternatives to Diagram-JS:
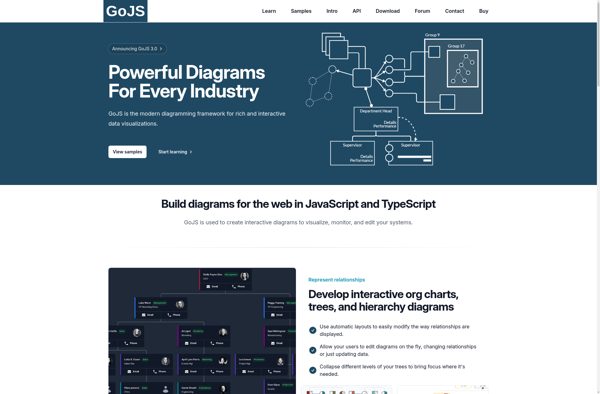
Suggest an alternative ❐GoJS
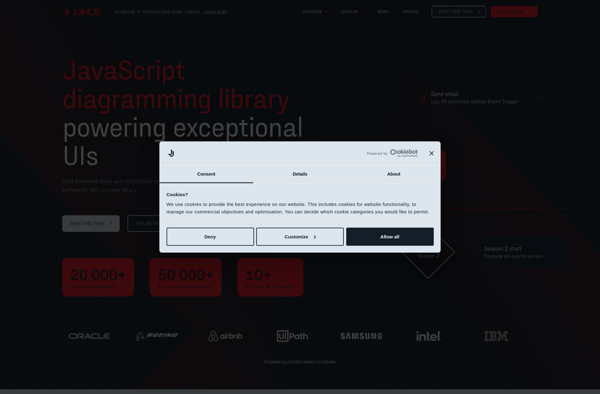
JointJS
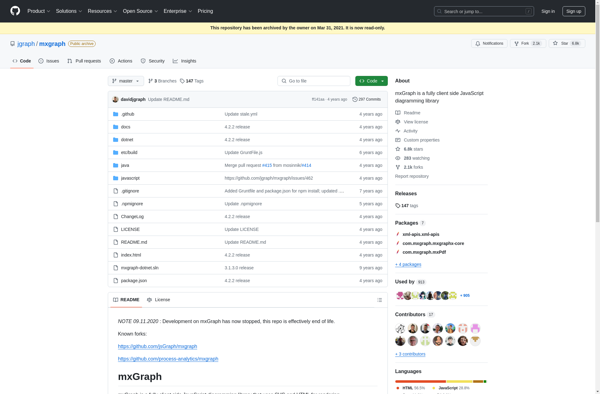
MxGraph
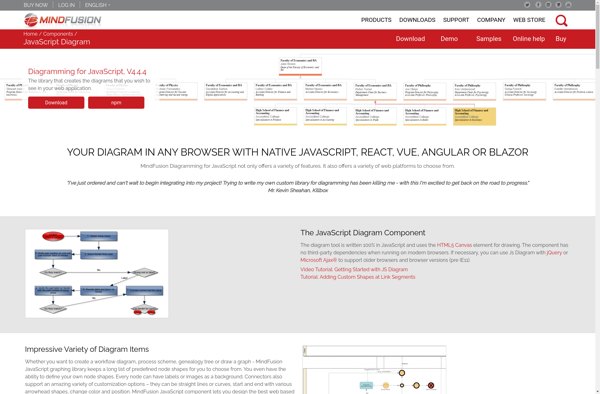
JsDiagram
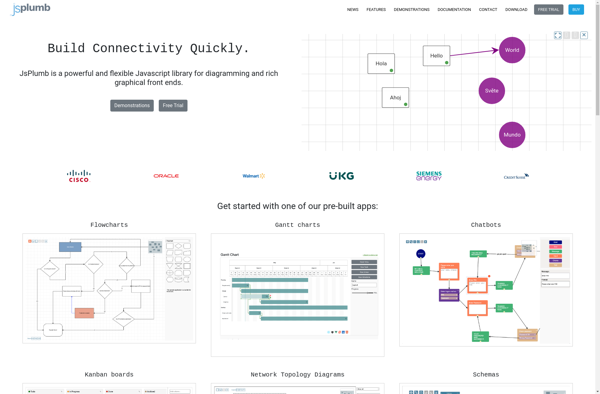
JsPlumb - JS Visualisation Library
Draw2D