JsDiagram is an open-source JavaScript library for creating diagrams and charts in web applications. It allows developers to easily add flowcharts, UML diagrams, BPMN diagrams, ER diagrams, network diagrams, and more using a simple API.
JsDiagram: Open-Source JavaScript Library for Creating Diagrams
Create flowcharts, UML diagrams, BPMN diagrams, ER diagrams, network diagrams, and more with JsDiagram's simple API, an open-source JavaScript library for web applications.
What is JsDiagram?
JsDiagram is an open-source JavaScript library for creating interactive diagrams and charts in web applications. Developed by JSDraw.io, it provides a complete set of drawing tools and shape libraries to help developers visualize and present data in an intuitive way.
Some key features of JsDiagram include:
Support for flowcharts, UML diagrams, BPMN, ER diagrams, network diagrams, organization charts, and more
Extensive shape libraries with hundreds of built-in shapes and icons
Drag-and-drop editing for easy diagram creation
Custom shape and theme support for branding diagrams
Export diagrams to PNG/JPEG/SVG/PDF formats
Responsive design that adapts diagrams to any screen size
Integration with popular frameworks like React, Angular and Vue.js
Programmatic access to diagrams for automation and customization
Touch-enabled diagrams for mobile devices
MIT license making it free to use in commercial applications
With its lightweight footprint, modular architecture and rich API, JsDiagram simplifies the process of adding interactive diagrams to web apps. It can be easily customized to match specific business needs. The library is free to use and open-source, licensed under MIT.
JsDiagram Features
Features
Drag and drop diagramming
Multiple diagram types (flowcharts, UML, ER diagrams, etc)
Customizable shapes and templates
Zooming and panning
Export diagrams as images
Programmatic creation of diagrams via API
Works with popular frameworks like React, Angular, Vue.js
Pricing
Open Source
Pros
Open source and free to use
Lightweight and easy to integrate
Good documentation and examples
Active development community
Extensible and customizable
Cons
Limited built-in shape libraries
Lacks some advanced diagramming features
Not as full-featured as some commercial alternatives
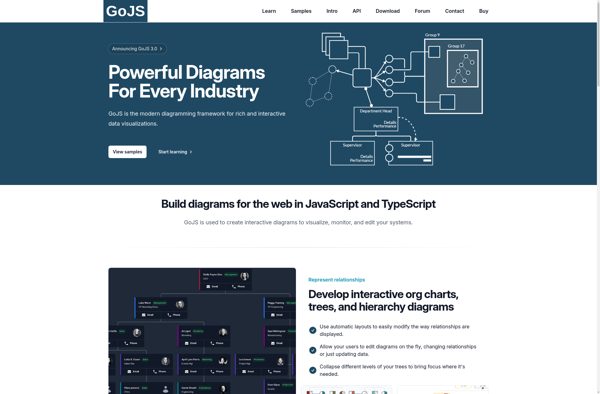
What Is GoJS?GoJS is a commercial JavaScript library for building interactive diagrams, charts, and graphs in web applications. It handles the rendering, layout, and user interaction for complex visual structures like flowcharts, org charts, BPMN diagrams, network topologies, and more.Key FeaturesGoJS provides automatic layout algorithms (tree, force-directed, layered, circular), data...
What Is JointJS?JointJS is an open-source JavaScript diagramming library for creating interactive diagrams and visualizations in web applications. It uses SVG rendering, making diagrams styleable with CSS and easily integrated into modern web frameworks.Key FeaturesJointJS provides a rich set of built-in shapes, connectors, and interactive elements including ports, anchors, and...
mxGraph is an open-source JavaScript diagramming library that allows developers to add advanced diagram and charting capabilities to web applications. It is highly customizable and supports various diagram types like flowcharts, org charts, ER diagrams, UML diagrams, network diagrams, BPMN and more.Some key features of mxGraph include:Works with modern web...
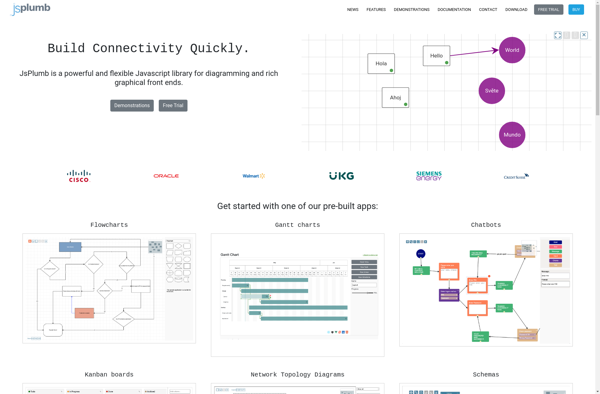
jsPlumb is an open-source JavaScript library for connecting and visualizing elements in a web interface. It provides a range of tools for creating diagrams, flowcharts, directed graphs, visual mapping and more.Some key features of jsPlumb include:Automatic drawing and adjusting of Bezier curves or straight line connectionsSupport for drag-and-drop connectivity between...
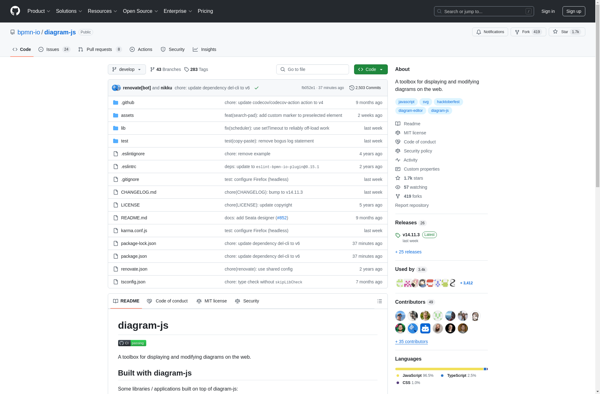
Diagram-JS is an open-source JavaScript library for creating flowcharts, BPMN diagrams, network diagrams, uml diagrams, entity relationship diagrams, and more. It provides a full-featured diagramming solution that runs in the browser.Some key features of Diagram-JS:Customizable canvas with panning, zooming, and scrollingExtensible through custom shapes, connectors, and featuresSupports touch devices and...
Draw2D is an open source JavaScript library for creating vector graphics, diagrams, charts, and graphical editors in web applications. It is built on HTML5 canvas and provides a rich API for generating and manipulating 2D shapes and diagrams.Some key features of Draw2D include:Vector graphic primitives like lines, circles, rectangles, etc.Advanced...