JointJS
JointJS — Open Source JavaScript Diagramming Library (2026)
JointJS is an open-source SVG-based diagramming library for web apps. Build interactive diagrams with drag-and-drop, custom shapes, and CSS styling.
What is JointJS?
What Is JointJS?
JointJS is an open-source JavaScript diagramming library for creating interactive diagrams and visualizations in web applications. It uses SVG rendering, making diagrams styleable with CSS and easily integrated into modern web frameworks.
Key Features
JointJS provides a rich set of built-in shapes, connectors, and interactive elements including ports, anchors, and link routing. It supports drag-and-drop, selection, resizing, and custom interaction handlers. The SVG-based rendering means every element is a DOM node that can be styled and animated with CSS.
The commercial version (JointJS+) adds advanced features like keyboard shortcuts, clipboard support, selection lasso, and additional shape libraries for specific diagram types (BPMN, UML, ERD, etc.).
Pricing
The core JointJS library is open source under the Mozilla Public License. JointJS+ (the commercial toolkit) requires a paid license starting at approximately 5,400 dollars per year for a team.
JointJS vs GoJS
JointJS uses SVG rendering which makes styling easier but can slow down with very large diagrams. GoJS uses Canvas which performs better at scale but is harder to style. JointJS's open-source core is a significant advantage for projects with limited budgets.
JointJS Features
Features
- Drag-and-drop diagramming
- Custom shapes and connectors
- Interactive elements like ports and anchors
- SVG and HTML rendering
- Serializing diagrams to JSON
- Custom data attributes
- Events and callbacks
- Plugins
Pricing
- Open Source
Pros
Cons
Official Links
Reviews & Ratings
Login to ReviewThe Best JointJS Alternatives
View all JointJS alternatives with detailed comparison →
Top Development and Diagramming & Modeling and other similar apps like JointJS
Here are some alternatives to JointJS:
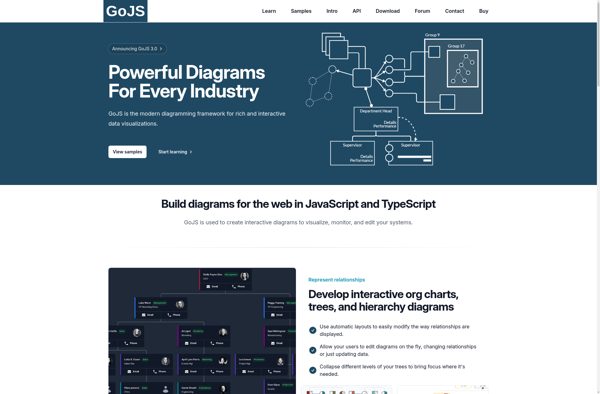
Suggest an alternative ❐GoJS
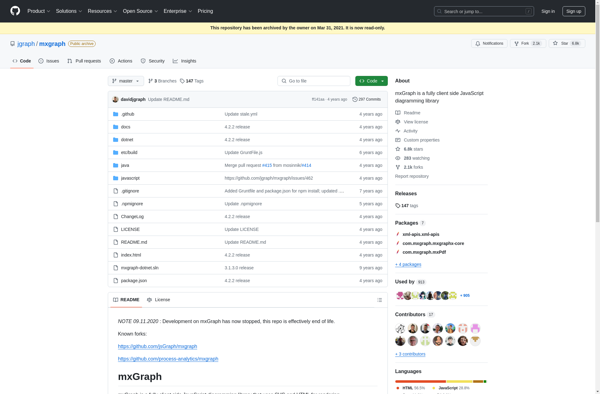
MxGraph
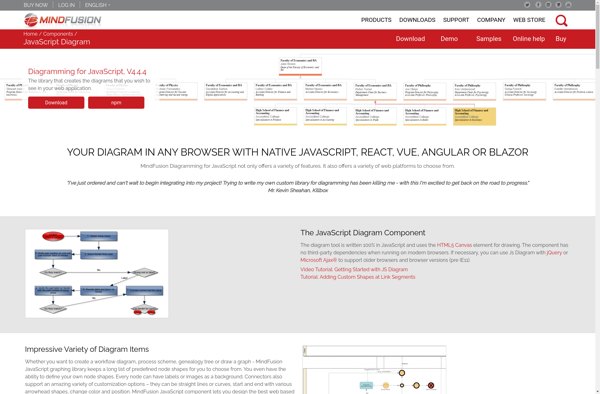
JsDiagram
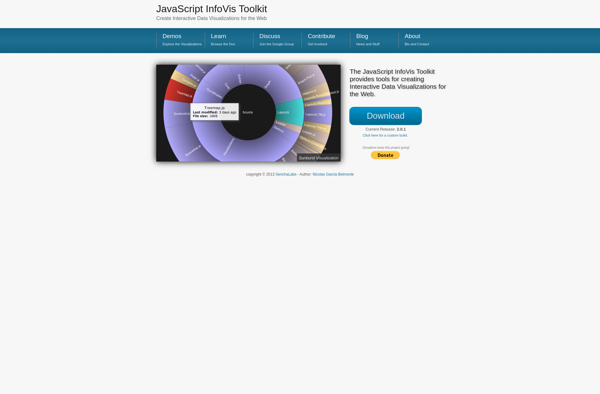
JavaScript InfoVis Toolkit
JsPlumb - JS Visualisation Library
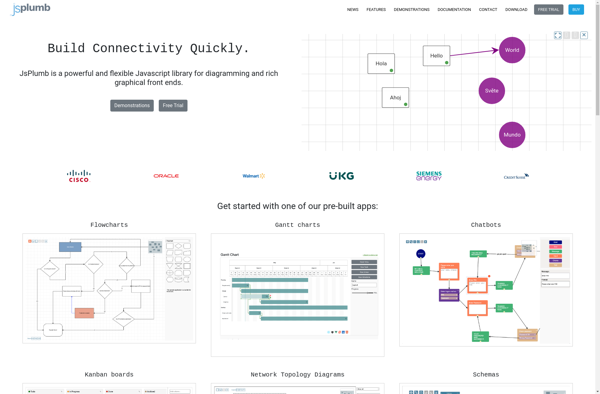
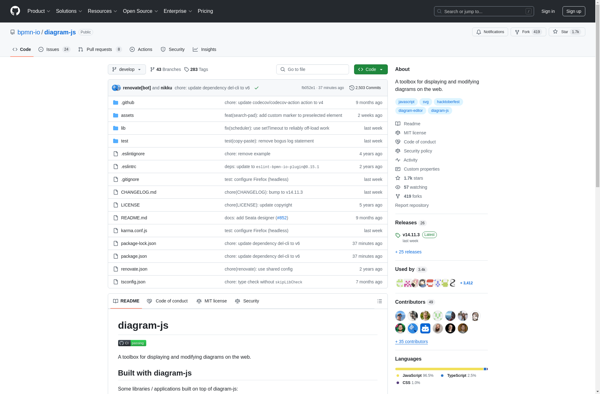
Diagram-JS
Draw2D