GoJS
GoJS — JavaScript Diagramming Library for Web Apps (2026)
GoJS is a commercial JS library for building interactive diagrams, flowcharts, and org charts. Canvas rendering, automatic layouts, and 200+ samples.
What is GoJS?
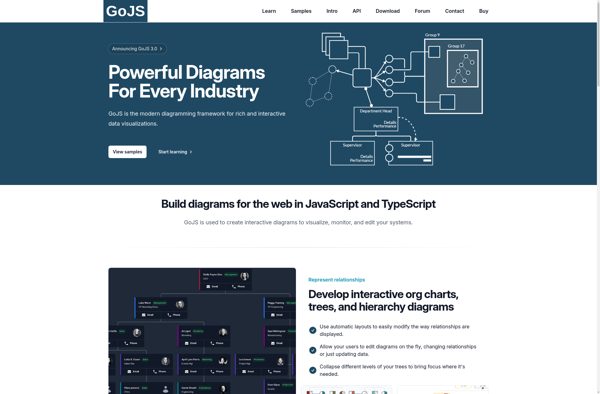
What Is GoJS?
GoJS is a commercial JavaScript library for building interactive diagrams, charts, and graphs in web applications. It handles the rendering, layout, and user interaction for complex visual structures like flowcharts, org charts, BPMN diagrams, network topologies, and more.
Key Features
GoJS provides automatic layout algorithms (tree, force-directed, layered, circular), data binding to JSON models, undo/redo support, and extensive customization of node and link appearance. It supports drag-and-drop, selection, resizing, linking, grouping, and context menus out of the box.
The library renders to HTML Canvas for performance, handling thousands of nodes smoothly. It includes built-in support for overview panels, palettes, and printing. Comprehensive documentation and over 200 sample diagrams make it relatively quick to get started.
Pricing
GoJS requires a commercial license for production use. Pricing starts at approximately 2,995 dollars for a single developer license. A free evaluation version is available for development and testing.
GoJS vs JointJS
GoJS and JointJS are the two leading JavaScript diagramming libraries. GoJS uses Canvas rendering for better performance with large diagrams, while JointJS uses SVG for easier CSS styling. GoJS has more built-in layout algorithms; JointJS offers more flexibility in custom rendering.
GoJS Features
Features
- Interactive diagramming library
- Customizable shapes, layouts, data binding
- Undo/redo functionality
- Diagramming templates
- Supports flowcharts, org charts, sequence diagrams and more
Pricing
- Free
- Commercial License
- Open Source
Pros
Cons
Official Links
Reviews & Ratings
Login to ReviewThe Best GoJS Alternatives
View all GoJS alternatives with detailed comparison →
Top Development and Diagramming & Modeling and other similar apps like GoJS
JointJS
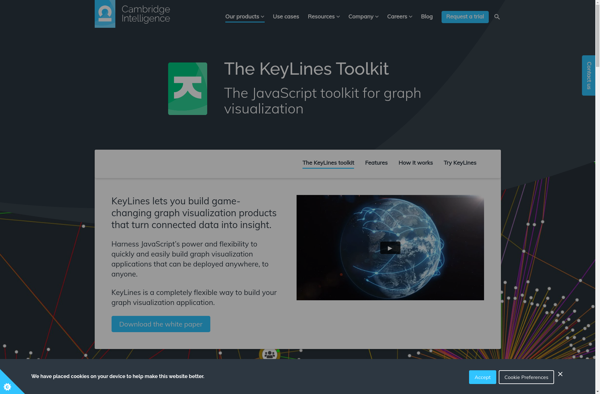
KeyLines Graph Visualization Toolkit
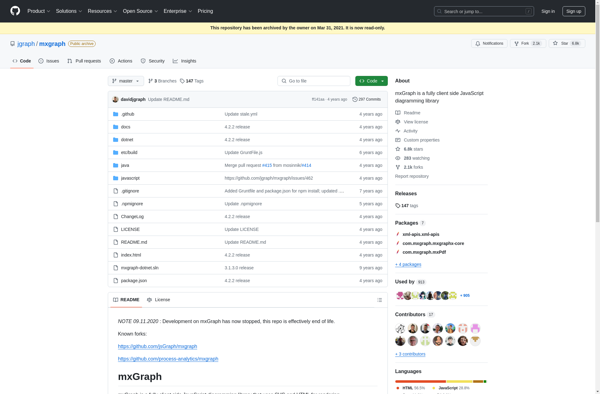
MxGraph
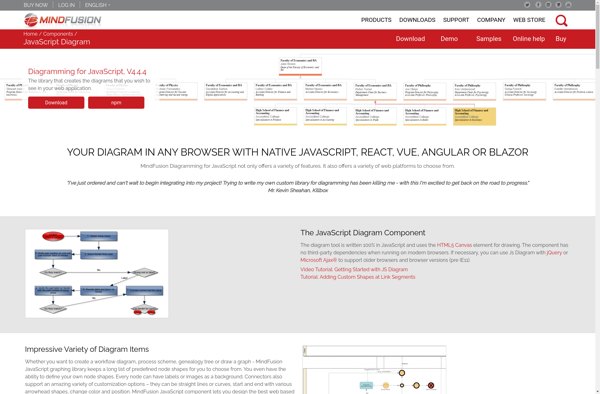
JsDiagram
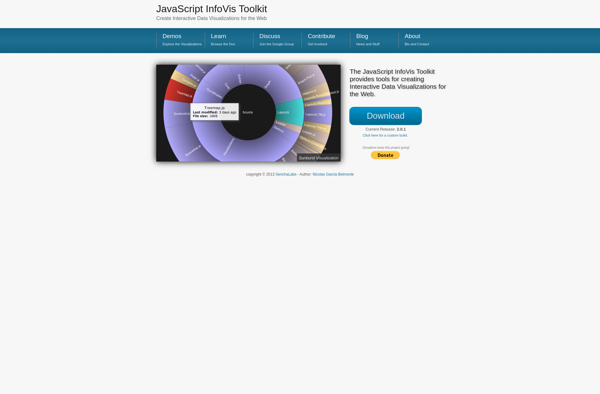
JavaScript InfoVis Toolkit
JsPlumb - JS Visualisation Library
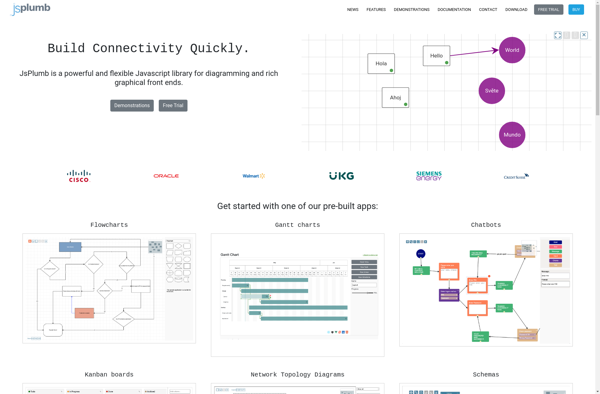
Diagram-JS
Draw2D