nmon vs gtop

Struggling to choose between nmon and gtop? Both products offer unique advantages, making it a tough decision.

nmon is a System & Hardware solution with tags like monitoring, performance, resource-utilization.

It boasts features such as Monitors CPU usage, Monitors memory usage, Monitors network I/O, Monitors disk I/O, Generates reports and graphs and pros including Free and open source, Lightweight and low overhead, Easy to use, Works on multiple platforms.

On the other hand, gtop is a System & Hardware product tagged with linux, terminal, monitoring, processes, cpu, memory.

Its standout features include Interactive dashboard with real-time graphs, Tracks CPU and memory usage, Shows statistics for processes, load averages, memory, and swap usage, Terminal-based interface, Open source, and it shines with pros like Lightweight and fast, Easy to use terminal interface, Good for quick system monitoring, Customizable dashboard, Free and open source.

To help you make an informed decision, we've compiled a comprehensive comparison of these two products, delving into their features, pros, cons, pricing, and more. Get ready to explore the nuances that set them apart and determine which one is the perfect fit for your requirements.

nmon

nmon

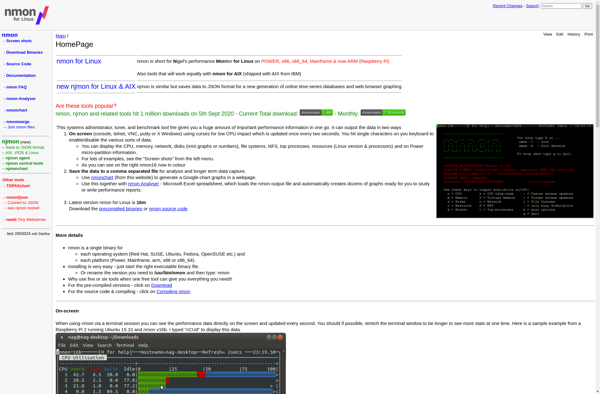
nmon is a free system monitor tool for the AIX and Linux operating systems. It is used to monitor system performance and resource utilization in real time.

Categories:
monitoring performance resource-utilization

Nmon Features

  1. Monitors CPU usage
  2. Monitors memory usage
  3. Monitors network I/O
  4. Monitors disk I/O
  5. Generates reports and graphs

Pricing

  • Open Source

Pros

Free and open source

Lightweight and low overhead

Easy to use

Works on multiple platforms

Cons

Limited built-in graphing capabilities

No web interface

Steep learning curve


gtop

gtop

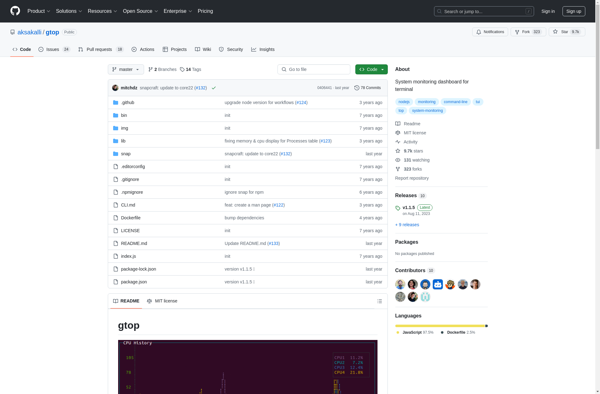
gtop is an open-source, terminal-based system monitoring utility for tracking CPU and memory usage on Linux systems. It shows an interactive dashboard with real-time graphs and statistics like processes, load averages, memory, and swap usage.

Categories:
linux terminal monitoring processes cpu memory

Gtop Features

  1. Interactive dashboard with real-time graphs
  2. Tracks CPU and memory usage
  3. Shows statistics for processes, load averages, memory, and swap usage
  4. Terminal-based interface
  5. Open source

Pricing

  • Open Source
  • Free

Pros

Lightweight and fast

Easy to use terminal interface

Good for quick system monitoring

Customizable dashboard

Free and open source

Cons

Terminal only, no GUI

Less detailed than full-featured monitoring tools

Limited to Linux systems

Steep learning curve for new users