Microsoft Power BI
Description: Microsoft Power BI is a business analytics service that enables users to visualize and analyze data, share insights across an organization, and make informed business decisions. It offers a suite of tools for data preparation, analysis, and visualization, facilitating interactive and compelling reports and dashboards.
Type: software
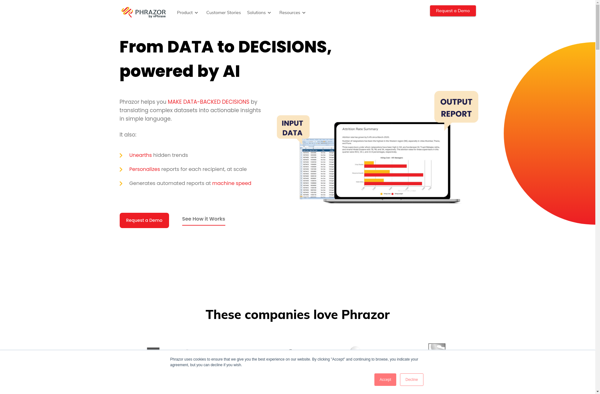
Phrazor
Description: Phrazor is a plagiarism detection software that compares student submissions against online sources and previous submissions to identify potential plagiarism or collusion. It generates originality reports highlighting matched content.
Type: software