picasso.js vs ZK Spreadsheet
A side-by-side look at picasso.js and ZK Spreadsheet. For an in-depth review of either product, follow the links below.

picasso.js
Photos & Graphics
Picasso.js is a charting library that allows you to easily create visualizations and charts in the browser using HTML5 Canvas. It has a simple API that makes it easy to quickly generate bar, line, pie and other charts with customizations like themes, interactivity, animations etc.
chartingdata-visualizationcanvashtml5
ZK Spreadsheet
Office & Productivity
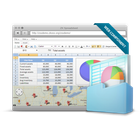
ZK Spreadsheet is an open-source spreadsheet software that is fast, lightweight and feature-rich. It is written in Java and offers Excel-comparable functions, charts, pivot tables, collaboration features and data bindings.
spreadsheetexcelchartspivot-tablescollaborationdata-binding
Related Comparisons
Google Charts
Plotly
Highcharts
CanvasJS Charts
Apache OpenOffice Calc