Dashboards.IO
Description: Dashboards.IO is a business intelligence and analytics platform that allows users to create interactive dashboards and reports. It has drag-and-drop functionality to build dashboards, along with data connectors to databases, cloud storage, APIs and more.
Type: software
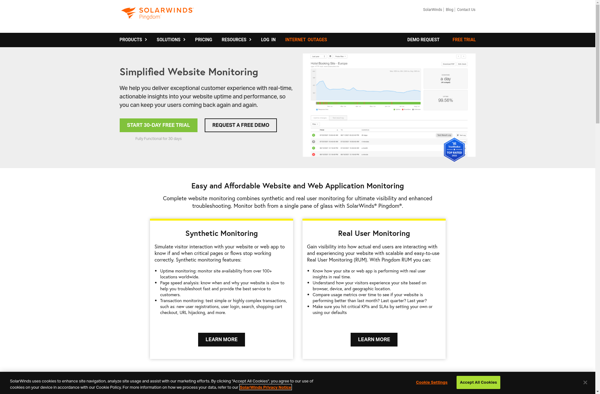
Pingdom
Description: Pingdom is a website monitoring service that checks uptime, performance, and speed of websites. It provides real-time alerts, detailed uptime and performance reports, and analytics on website issues.
Type: software
Pricing: Freemium