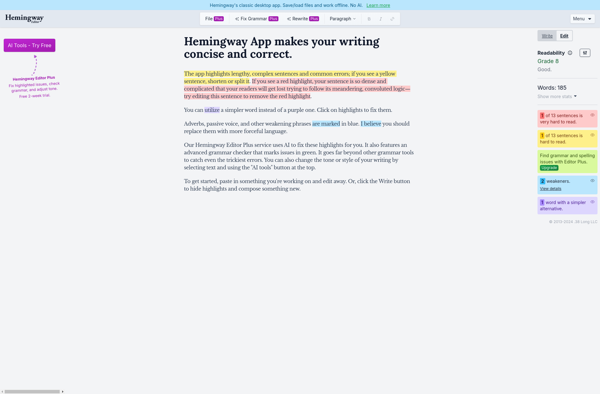
Hemingway Editor
Description: Hemingway Editor is a text editor app that highlights complex and hard-to-read sentences. It aims to make writing bold and clear. The app offers a readable grade level score based on the complexity of sentences. It works as a grammar checker and style editor to improve the clarity of writing.
Type: software
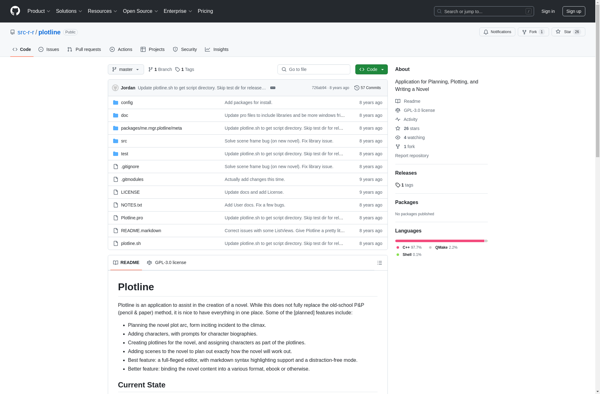
Plotline
Description: Plotline is a free, open-source data visualization and charting software. It allows users to easily create a variety of 2D and 3D charts and graphs to visualize data. Key features include drag-and-drop interface, templating, exporting, and integration with various data sources.
Type: software
Pricing: Open Source