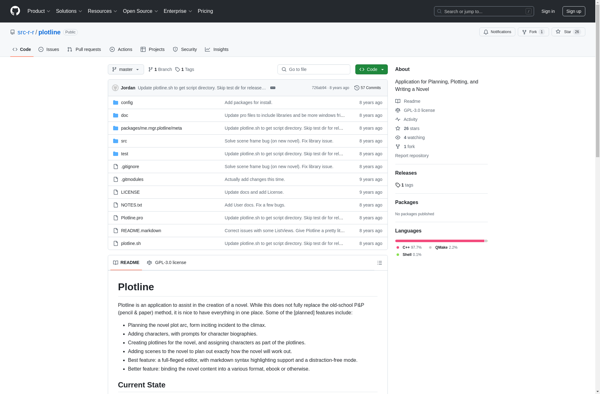
Plotline is a free, open-source data visualization and charting software. It allows users to easily create a variety of 2D and 3D charts and graphs to visualize data. Key features include drag-and-drop interface, templating, exporting, and integration with various data sources.
Free open-source charting software for creating 2D & 3D charts and graphs, with drag-and-drop interface, templating, exporting, and data source integration.
What is Plotline?
Plotline is a free, open-source data visualization and charting software. It provides an intuitive drag-and-drop interface that allows users to easily create a variety of 2D and 3D charts and graphs to visualize data, without needing to know any programming or charting syntax.
Some of the key features and capabilities of Plotline include:
Intuitive drag-and-drop interface to quickly build charts and graphs
Supports various 2D chart types like bar charts, pie charts, line/area graphs, scatter plots, heat maps and more
Includes 3D chart types such as surface charts, wireframe graphs and contour plots
Easy customization of chart layout, colors, labels, axes etc
Chart templating for reusing chart configurations
Import/export data from/to CSV, JSON and Excel formats
Export charts in PNG, JPEG, PDF and other image formats
Embed or share charts via URLs
Connect to data sources like SQL databases, REST APIs etc
Open source software released under GNU GPLv3 license
Cross platform - works on Windows, Mac and Linux
With its user-friendly interface and wide array of features, Plotline is an excellent free alternative to paid charting and data visualization platforms for personal as well as business usage.
Scrivener is a popular software program designed specifically for writers. It allows you to plan, organize, and write long and complex documents like books, dissertations, screenplays, and more. Some key features of Scrivener include:Corkboard and outliner views to visualize the structure of your writing projectAnnotations and comments to leave notes...
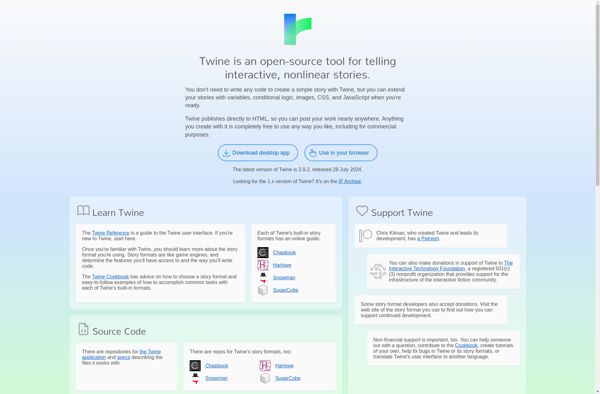
Twine is an open-source software tool originally created by Chris Klimas in 2009 for easily creating interactive and nonlinear textual stories, RPGs, adventure games, or interactive fiction games. The stories created in Twine consist of textual 'passages' that link together into branching or looping narratives based on user choices.A key...
yWriter is a free and open-source word processor and story development tool designed specifically for novelists. It allows you to break down your novel into chapters and scenes, create characters, locations, items, view storyboards, track all aspects of your story, and more to help organize and structure your writing process.Some...
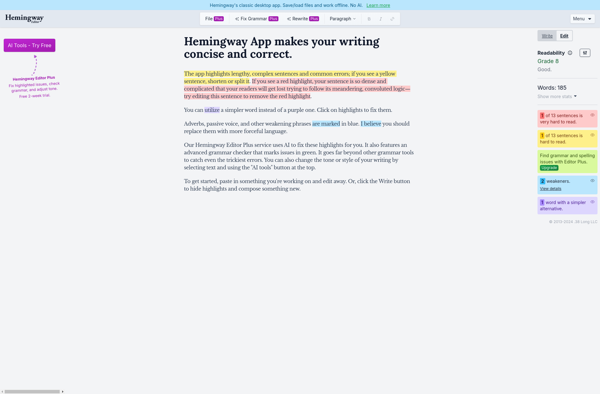
Hemingway Editor is a text editing application designed to make writing bolder and clearer. It functions similarly to a grammar checking tool, but has a stronger focus on identifying overly complex and difficult to read sentences.The core feature of Hemingway Editor is the readability scoring system. As you write or...
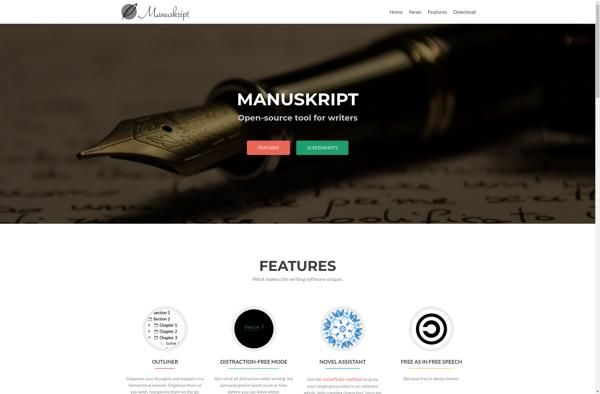
Manuskript is a free, open-source writing app designed specifically for fiction writers. It helps organize stories, characters, plots, and writing projects in one place to boost productivity.Key features include:Outline editor to plan story beats and organize contentCharacter and worlds database to track detailsCorkboard and index cards to rearrange chapters/scenesStatistics and...
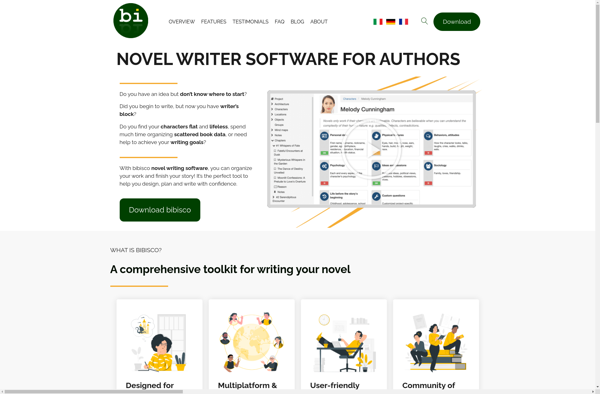
Bibisco is a free, open-source novel writing software designed to help authors organize and structure their ideas into a full book outline. It allows for easy brainstorming and planning of key story elements like characters, locations, chapters, scenes, etc. Authors can use Bibisco to map out an entire novel before...
oStorybook is an open-source tool for designing and prototyping user interfaces. It integrates into your development workflow to enable faster UI development and testing.With oStorybook, developers and designers can build components and pages, add interactions and animations, and test designs without needing to spin up backends or navigate complex app...
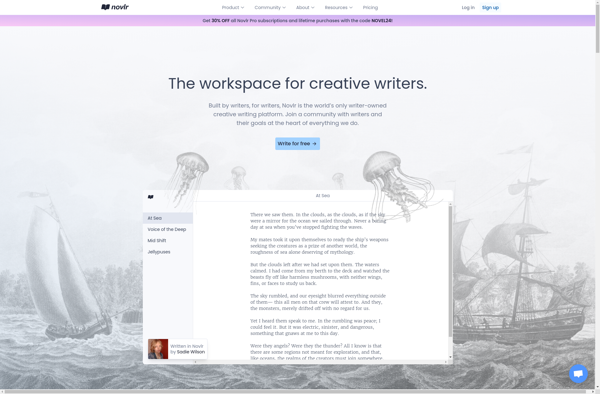
Novlr is a free, open-source novel writing software that helps fiction writers organize and manage their writing projects. Some of the key features of Novlr include:Writing Spaces - Novlr allows you to create multiple writing spaces for different parts of your novel or separate stories. You can organize chapters, scenes,...
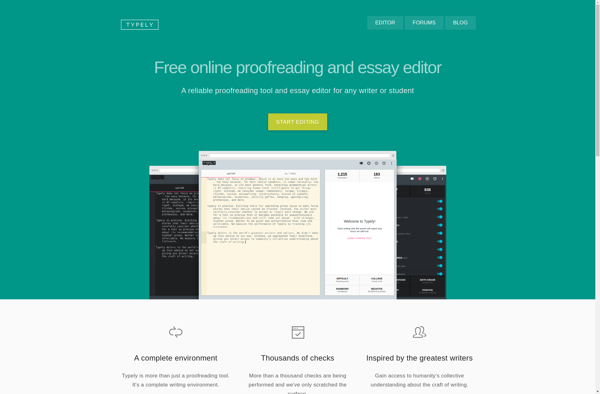
Typely is a minimalist writing application designed to help authors focus on their craft with fewer distractions. It provides a clean, simple interface with only the basic necessary formatting tools so writers can concentrate on their content rather than getting bogged down in complex menus and options.The editing screen in...
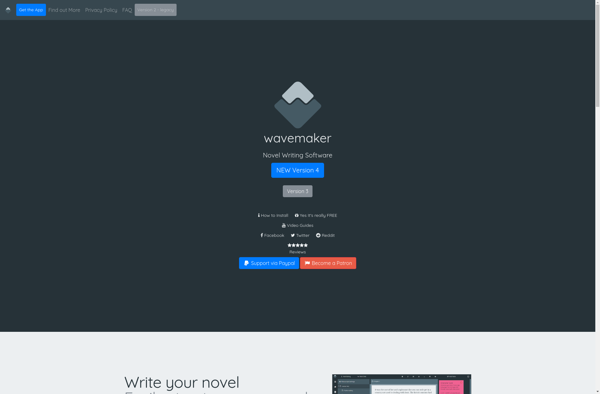
Wavemaker Novel Writing is a writing software designed specifically for fiction authors. It provides various tools to help manage, organize, and track all aspects of the novel writing process.Some key features of Wavemaker include:Idea boards to capture and categorize notes, ideas, locations, characters, etc.Plot and timeline trackers to visualize and...
Writing Outliner is software designed specifically for authors to visually outline and organize story ideas, plot points, characters, scenes, and narrative flow when writing long-form fiction or non-fiction manuscripts like books, novellas, scripts, etc.Key features include:Intuitive outlining interface to break a story down into acts, sequences, scenes, beats etc. in...