RAWGraphs
Description: RAWGraphs is an open-source data visualization software that allows users to create a variety of charts and graphs from spreadsheet data. It has an intuitive drag-and-drop interface for easily customizing visualizations.
Type: software
Pricing: Open Source
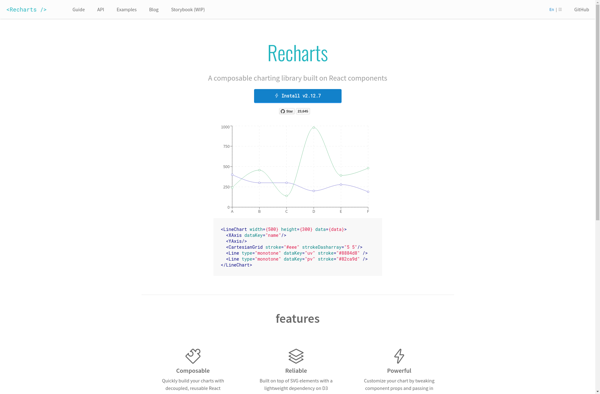
Recharts
Description: Recharts is a popular React charting library for building data visualizations. It offers many customizable chart types including line, bar, pie, radar, treemap and more. Recharts is easy to use, responsive, interactive and leverages SVG for rendering.
Type: software
Pricing: Open Source