BlueSky Statistics
Description: BlueSky Statistics is an open-source data analysis software that allows users to explore, visualize, and model their data. It features an intuitive graphical user interface, interactive graphics and statistics tools, and the ability to work with large datasets.
Type: software
Pricing: Open Source
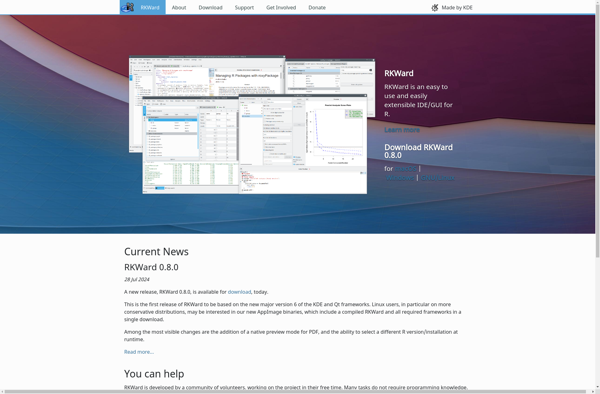
RKWard
Description: RKWard is an open-source graphical user interface for the R statistical programming language. It provides an integrated development environment to work with R code, data, plots, models and reports.
Type: software
Pricing: Free