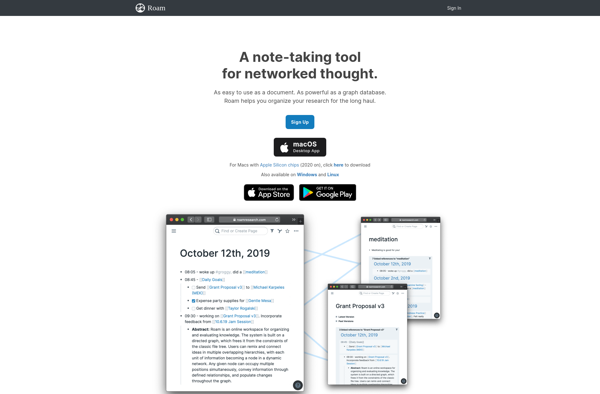
Struggling to choose between Roam Research and Unigraph? Both products offer unique advantages, making it a tough decision.
Roam Research is a Ai Tools & Services solution with tags like notetaking, knowledge-management, graph-database.
It boasts features such as Graph database for connecting ideas, Bi-directional linking between pages, Backlinks to see where ideas are connected, Daily notes and page previews, Block references for reusing content, Markdown formatting and equations, Page embeds and synced block references, Filters and full text search and pros including Powerful knowledge management, Flexible structure for notes, Easy to make connections between ideas, Daily notes keep history organized, Great for networked thought.
On the other hand, Unigraph is a Ai Tools & Services product tagged with knowledge-graph, data-modeling, graph-database.
Its standout features include Graph database to store and query connected data, Visual editor to model entities and relationships, Support for importing data from CSV, JSON, etc, Collaborative knowledge graph building, Exploration of connections between data, Customizable visualization of knowledge graphs, REST API access, Open source with Apache 2.0 license, and it shines with pros like Intuitive visual interface, Powerful knowledge graph capabilities, Open source and customizable, Active development community, Scalable to large datasets, Free to use.
To help you make an informed decision, we've compiled a comprehensive comparison of these two products, delving into their features, pros, cons, pricing, and more. Get ready to explore the nuances that set them apart and determine which one is the perfect fit for your requirements.
Roam Research is a note-taking and knowledge management app focused on building networks of thought. It allows users to capture ideas, make connections between concepts, and organize information in a flexible graph database.
Unigraph is an open-source knowledge graph platform that allows users to build knowledge graphs and explore connections between data. It features a graph database and visual editor to model, store, and visualize data relationships.