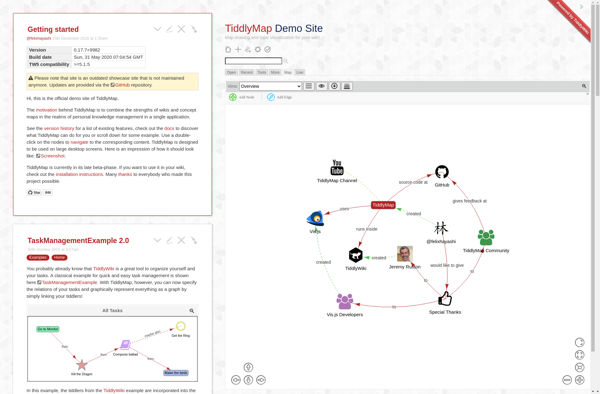
TiddlyMap
Description: TiddlyMap is an open-source personal knowledge management and mind mapping tool. It allows users to organize ideas and information in an interactive, customizable visual map.
Type: software
Pricing: Open Source
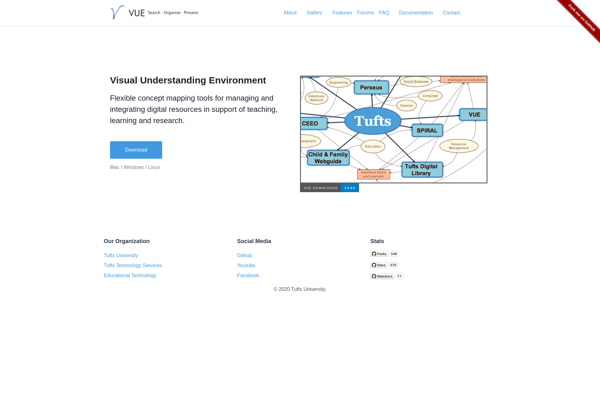
Visual Understanding Environment
Description: The Visual Understanding Environment (VUE) is an open-source data visualization application developed by Tufts University. It allows users to visualize, analyze, and present complex data in 2D and 3D interfaces.
Type: software
Pricing: Open Source