Mermaid
Description: Mermaid is an open-source tool that allows you to create diagrams and visualizations using text and code. It is designed to integrate with documentation sites and wikis to add charts and graphs through a simple markdown-inspired script language. The key benefit is the ability to generate complex diagrams that are portable, themeable, and easy to edit programmatically.
Type: software
Pricing: Open Source
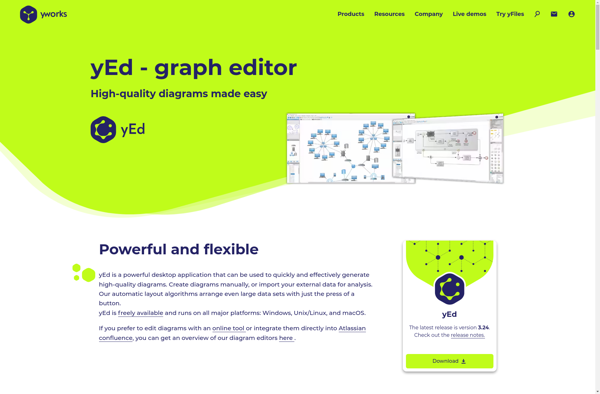
yEd Graph Editor
Description: yEd is a free and open-source diagramming software for Windows, macOS, and Linux. It allows users to quickly and easily create diagrams like flowcharts, network diagrams, UML diagrams, BPMN diagrams, org charts, and more. yEd has automatic layout algorithms to tidy up diagram layouts.
Type: software
Pricing: Open Source