Awesome Table

Awesome Table: Spreadsheet and Data Visualization Softwares
Awesome Table is a spreadsheet and data visualization software for creating tables, charts, dashboards and more to analyze, summarize and visualize data. It has an intuitive drag-and-drop interface to build reports and dashboards quickly without coding.
What is Awesome Table?
Awesome Table is a powerful spreadsheet, data analysis and visualization software used by individuals and businesses to analyze, summarize and visualize data in new ways. With an easy-to-use drag-and-drop interface, Awesome Table makes it simple for anyone to connect data from multiple sources, create interactive dashboards and build reports to uncover key insights from their data.
Some key features of Awesome Table include:
- Intuitive drag-and-drop interface to easily build reports, dashboards, charts and pivot tables without coding
- Connect and combine data from multiple sources like SQL, JSON, CSV, Excel etc.
- Powerful calculation and transformation capabilities to clean, shape and enrich data
- Hundreds of customizable visualization types including tables, bar, line and pie charts, gauges, maps etc.
- Interactive dashboards to filter, drill down and explore data
- Collaboration tools to share reports and dashboards with others
- Scheduling and alerts to automate delivery of reports and get notified of data changes
- APIs and integrations with business systems like Salesforce, Marketo etc.
- On-premise and secure cloud deployment options available
With an easy-to-use interface and broad set of data analysis capabilities, Awesome Table is the ideal reporting, analytics and data visualization software for business users, analysts, IT and database professionals looking to better understand their data for smarter decision making.
Awesome Table Features
Features
- Drag-and-drop interface for building reports and dashboards
- Variety of charts and visualizations (line, bar, pie, scatter, etc.)
- Pivot tables for data analysis
- Formulas and functions for calculations
- Collaboration tools
- APIs and integrations with databases and other apps
- Import/export data from Excel, CSV, etc.
Pricing
- Freemium
- Subscription-Based
Pros
Cons
Official Links
Reviews & Ratings
Login to ReviewThe Best Awesome Table Alternatives
View all Awesome Table alternatives with detailed comparison →
Top Office & Productivity and Spreadsheets and other similar apps like Awesome Table
Trunao

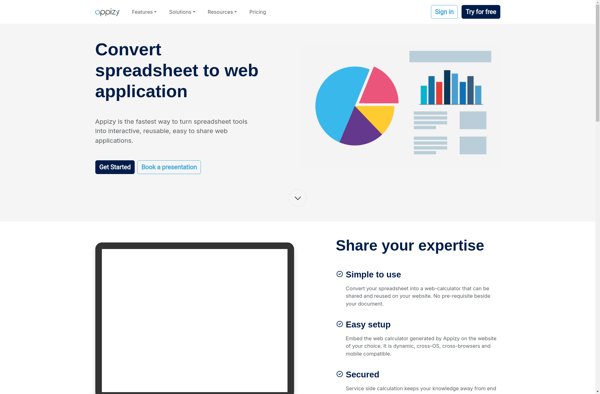
Appizy
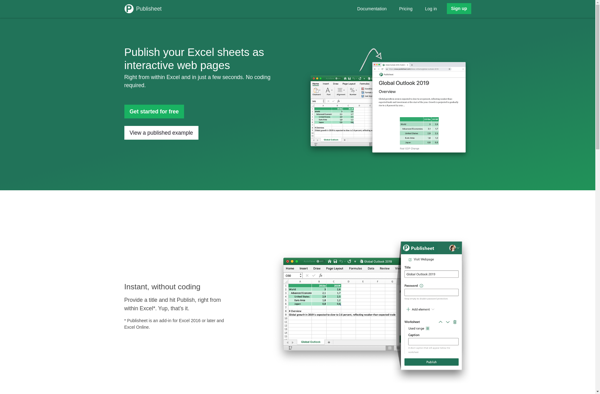
Publisheet