Chart Mage

Chart Mage

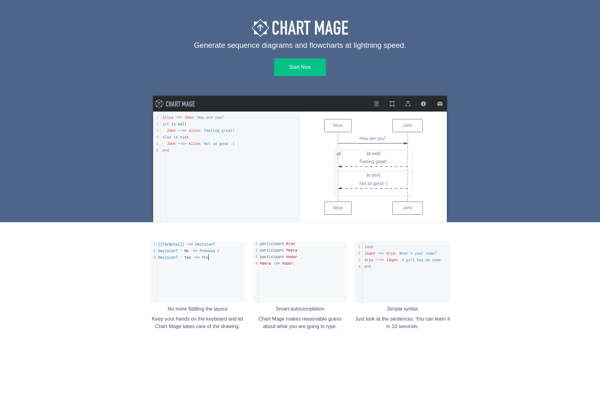
Chart Mage is a data visualization and chart creation software. It allows users to easily connect to data sources, choose from over 30 chart types, customize the look and feel, and publish interactive charts. The software is user-friendly with a drag and drop interface.
Chart Mage image
charts data-visualization interactive-charts

Chart Mage: Data Visualization and Chart Creation Software

Discover Chart Mage, a user-friendly data visualization tool with 30+ chart types, drag-and-drop functionality, and interactive publishing capabilities.

What is Chart Mage?

Chart Mage is an easy-to-use data visualization and chart creation software that allows anyone to visualize complex data into insightful, interactive charts and dashboards. With Chart Mage, users can quickly connect to a variety of data sources like Excel, SQL databases, rest APIs and more to import data for analysis. The software comes packed with over 30 chart types including popular options like bar, line, pie, scatter, maps as well as more advanced charts like heatmaps, chord diagrams, waterfall and funnel charts.

A key highlight of Chart Mage is its user-friendly drag and drop interface that makes data visualization very simple even for non experts. Users can just drag fields from the data panel into the respective axes and with just a few clicks, beautiful interactive charts are created. There are also dozens of customization options available allowing users to tweak everything from colors, labels, legends to more cosmetic aspects of the charts.

Another great feature about Chart Mage is its powerful dashboard builder. It allows users to place multiple charts into interactive dashboards that can then be shared with others or embedded into websites and blogs. The dashboards come with filters, selectors, date pickers and more interactive features to slice and dice data on the fly. With collaborators feature, teams can also build dashboards together.

On the whole Chart Mage is one of the most user friendly yet full featured chart makers in the market. It strikes a nice balance between simplicity and customization features making it a great choice both for charting beginners as well as power users.

Chart Mage Features

Features

  1. Drag-and-drop interface for creating charts
  2. Connects to various data sources like Excel, CSV files, databases
  3. Over 30 chart types including bar, pie, line, scatter, maps
  4. Customizable chart design, colors, fonts, etc
  5. Animations and interactivity for charts
  6. Ability to export charts as images, PDFs, embed code

Pricing

  • Freemium
  • Subscription-Based

Pros

User-friendly and easy to use

Great for quickly visualizing data

Many customization options for charts

Interactive and animated charts

Connects to many data sources

Cons

Limited advanced analytics features

Not many options for complex/advanced chart types

Formatting options could be better for some chart types


The Best Chart Mage Alternatives

Top Office & Productivity and Data Visualization and other similar apps like Chart Mage


Draw.io icon

Draw.io

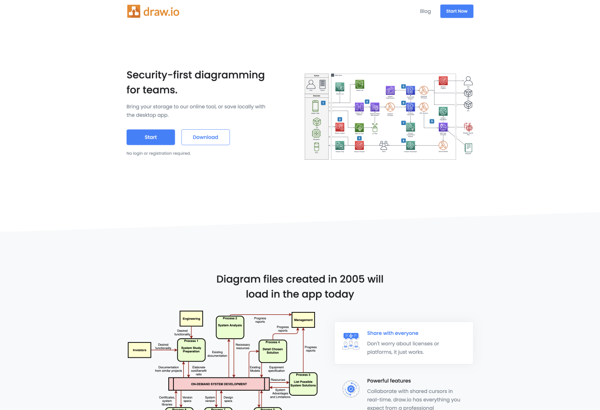
draw.io is a feature-rich diagramming and flowchart software that runs in your web browser. As a freemium tool, draw.io offers a free basic version as well as paid plans with more functionality for professionals and teams.With an intuitive drag-and-drop interface and built-in shape libraries, draw.io makes it easy for anyone...
Draw.io image
Mermaid icon

Mermaid

Mermaid is an open-source visualization tool that allows users to create a variety of charts, diagrams, and visualizations using a simple text-based language. Some of the key benefits and capabilities of Mermaid include:Text-based - No need to use cumbersome GUI diagram editors. Diagrams are defined using a markdown-inspired text language...
Mermaid image
Visual Paradigm icon

Visual Paradigm

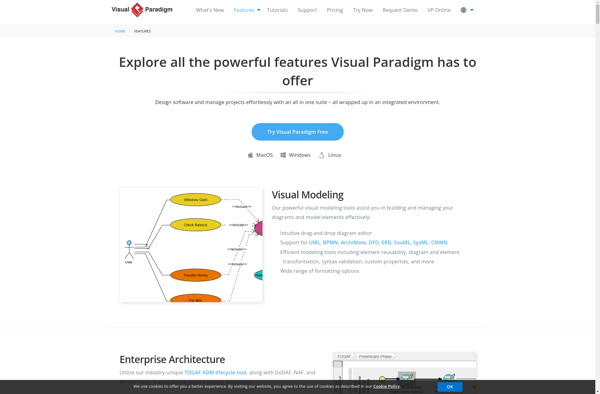
Visual Paradigm is a professional UML modeling software used by software developers and architects for software design and architecture. It supports all standard UML 2.x diagrams like use case diagrams, class diagrams, sequence diagrams, activity diagrams, communication diagrams, state machine diagrams, deployment diagrams, component diagrams, and more.Key features of Visual...
Visual Paradigm image
DBDiagram.io icon

DBDiagram.io

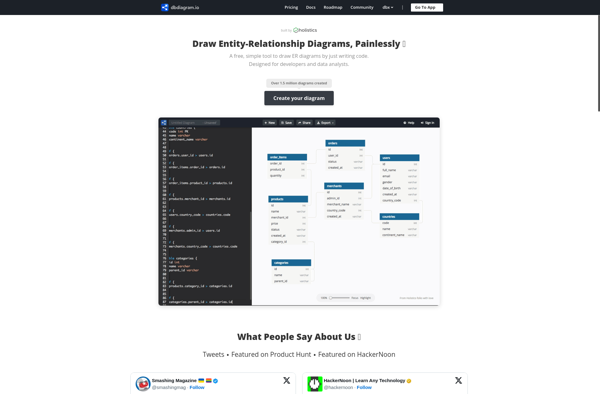
DBDiagram.io is a free online database diagram and modeling tool used to visually design, document and plan relational databases. It provides an intuitive graphical interface and rapid drag & drop tools to help build Entity Relationship Diagrams (ERDs), database schemas, data models, AWS diagrams, wireframes and more.Key features include:Intuitive visual...
DBDiagram.io image
Code2flow icon

Code2flow

Code2flow is an open-source web application that helps developers visualize and document code by generating UML diagrams automatically from source code. It supports reverse engineering code into various UML diagram types like class diagrams, sequence diagrams, and more.Some key features of Code2flow:Supports major programming languages like Java, C#, Python, PHP,...
Code2flow image
SQLDbm icon

SQLDbm

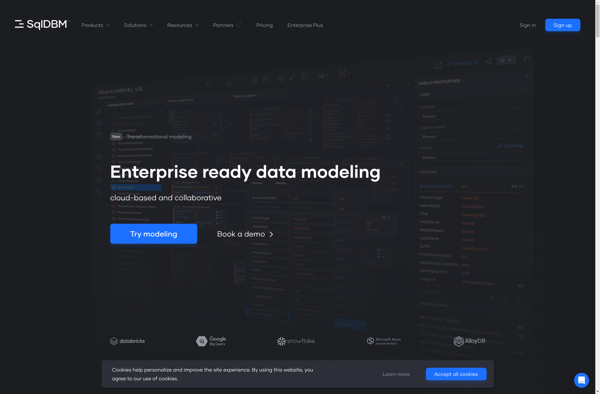
SQLDbm is an open-source relational database management system (RDBMS) that uses structured query language (SQL) to access and manipulate data stored in disk files. It implements most SQL standards and can be used as a lightweight, easy-to-use alternative to more complex database servers.Some key features of SQLDbm include:Uses simple disk...
SQLDbm image
DIagrams Through Ascii Art icon

DIagrams Through Ascii Art

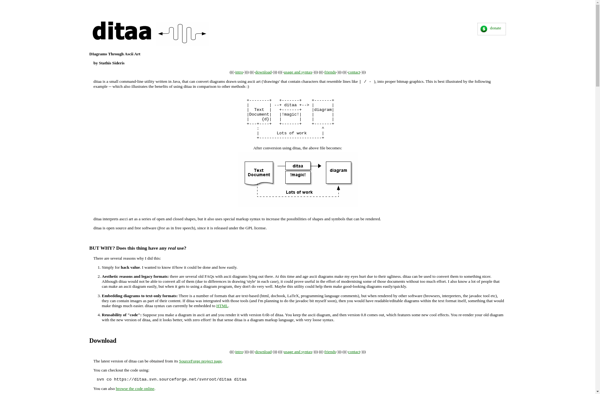
DIagrams Through Ascii Art is a free web-based application that enables users to create basic diagrams and charts using ASCII characters. With its simple and intuitive interface, it allows anyone to quickly generate diagrams without the need for additional software.Some key features of DIagrams Through Ascii Art include:Supports various diagram...
DIagrams Through Ascii Art image
QuickDBD icon

QuickDBD

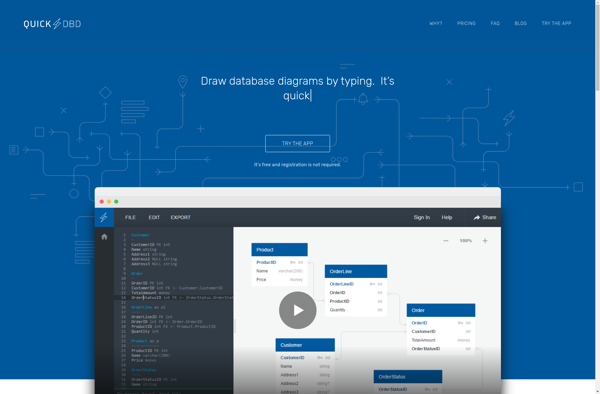
QuickDBD is a free online database diagram designer and modeling tool created by StackBy. It allows users to visually create entity relationship diagrams, conceptual data models, database schemas, flowcharts, UI mocks, and more for software and application planning and documentation.With an intuitive drag-and-drop interface, users can easily design diagrams that...
QuickDBD image
ASCIIFlow icon

ASCIIFlow

ASCIIFlow is a free online text-based diagram drawing application that allows users to quickly create a variety of text ascii diagrams and charts. With its simple and intuitive interface, users can easily draw flowcharts, network diagrams, organizational charts, UML diagrams, sitemaps, wireframes and more using standard keyboard characters and symbols.Some...
ASCIIFlow image
Flowchart.js icon

Flowchart.js

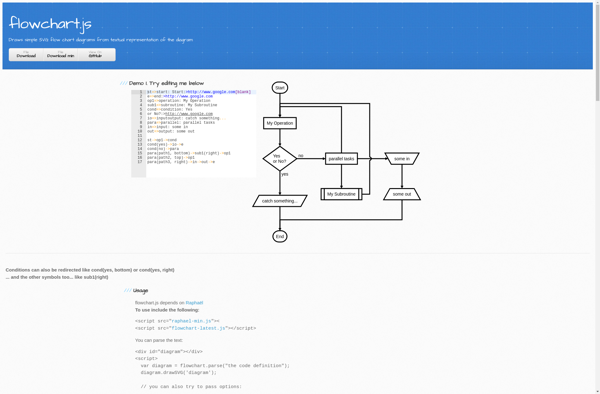
Flowchart.js is an open-source JavaScript library for easily creating flowcharts, diagrams, and graphs within web applications. It is designed to be simple and lightweight, relying only on native HTML5 canvas and JavaScript functionality rather than external libraries or plugins.Some key features of Flowchart.js include:Straightforward declarative syntax for defining flowchart components...
Flowchart.js image
Azimutt icon

Azimutt

Azimutt is a mind mapping and information visualization tool developed by Stradivarius Software. It allows users to create concept maps, flowcharts, organizational charts, mind maps, and other types of diagrams to organize and visualize information.Key features of Azimutt include:Cross-platform compatibility - works on Windows, Mac, and LinuxMultiple diagram types -...
Azimutt image
Asciio icon

Asciio

Asciio is a free online vector graphics editor that runs in web browsers. It provides a wide range of illustration, diagramming and drawing tools for creating 2D graphics. Some of its key features include:Intuitive drawing and shaping tools like lines, curves, rectangles, ellipses etc.Pre-made shapes and symbols for flowcharts, UI...
Asciio image
Elm bot lines icon

Elm bot lines

Elm bot lines is an open-source chatbot platform designed to help users create conversational bots for various use cases. It allows building bots visually using a drag-and-drop interface without the need for coding.Some key features of Elm bot lines include:Visual bot builder with a flow editor to build conversationsDrag-and-drop elements...
Elm bot lines image