DataJoy

DataJoy

DataJoy is a data analytics and business intelligence platform that allows users to connect, prepare, and visualize data. It has an easy-to-use drag and drop interface to build reports, dashboards, and workflows.
DataJoy image
data-analytics business-intelligence data-visualization reporting dashboards

DataJoy: Data Analytics and Business Intelligence Platform

Data analytics and business intelligence platform with a drag-and-drop interface for building reports, dashboards, and workflows.

What is DataJoy?

DataJoy is a business intelligence and analytics platform designed to help companies make data-driven decisions. It provides an intuitive, drag-and-drop interface that allows users without technical skills to easily connect to data sources, prepare and clean data, and create interactive reports and dashboards.

Key features of DataJoy include:

  • Connecting to databases, cloud apps, files, etc. It has over 300 native connectors.
  • Data preparation tools like joining tables, filtering, formatting, and derived columns.
  • Interactive reporting to create tables, charts, graphs and pivot tables.
  • Collaboration capabilities to share reports and provide comments.
  • Scheduled report distribution and alerts based on set conditions.
  • Exporting to PowerPoint, Excel, PDF formats.
  • Administrative functions like user access control, usage monitoring, etc.
  • APIs and embedding options to include reports in other apps.

Overall, DataJoy is an intuitive BI platform aimed at business users rather than just analysts. With its easy to use interface and extensive visualization capabilities, DataJoy enables organizations to democratize their data and empower employees to make better decisions.

DataJoy Features

Features

  1. Drag-and-drop interface for building reports, dashboards and workflows
  2. Connects to various data sources like databases, cloud apps, files
  3. Data preparation tools for cleaning, transforming and enriching data
  4. Visualization and charting capabilities
  5. Collaboration features like sharing dashboards and annotations
  6. Alerts and scheduled reports
  7. API access and integrations

Pricing

  • Freemium
  • Subscription-Based

Pros

User-friendly and intuitive

Powerful data preparation capabilities

Great visualization options

Scales to large data volumes

Good value for money

Cons

Steep learning curve for advanced features

Limited customization options for visualizations

Mobile app needs improvement

Can be slow with very large datasets


The Best DataJoy Alternatives

Top Business & Commerce and Business Intelligence & Analytics and other similar apps like DataJoy

Here are some alternatives to DataJoy:

Suggest an alternative ❐

Mathematica icon

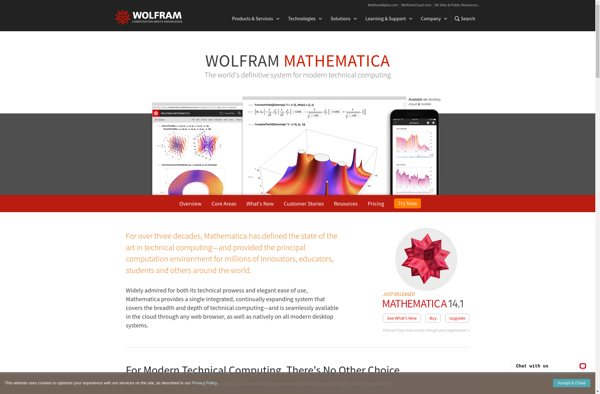
Mathematica

Mathematica is a computational software program developed by Wolfram Research. It is used for symbolic and numerical mathematics, data visualization, image processing, and a wide range of technical computing applications.Some key features of Mathematica include:A symbolic algebra engine that can manipulate mathematical expressions, solve equations, simplify expressions, compute derivatives and...
Mathematica image
Maple icon

Maple

Maple is a proprietary computer algebra system or CAS designed for mathematical computation and modeling. It was first developed in 1980 by the Symbolic Computation Group at the University of Waterloo in Canada.Some of the key capabilities Maple offers include:Algebraic manipulation - simplify expressions, solve equations, factor polynomials, compute limits,...
Maple image
Scilab icon

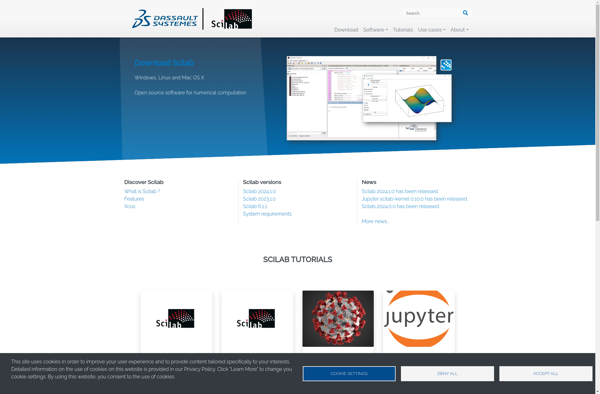
Scilab

Scilab is an open source, cross-platform numerical computational package and a high level, numerically oriented programming language. It provides an interpreted programming language, linear algebra operations, numerical optimization, signal processing features, and the ability to plot functions and data.Originally created in 1990 by researchers from INRIA and ENPC in France,...
Scilab image
RStudio icon

RStudio

RStudio is a popular open-source IDE for R, a programming language for statistical computing and graphics. It provides a user-friendly graphical user interface that makes working with R much easier by integrating tools for plotting, debugging, workspace management, and other features.Some key features of RStudio include:Code editor with syntax highlighting,...
RStudio image
GNU Octave icon

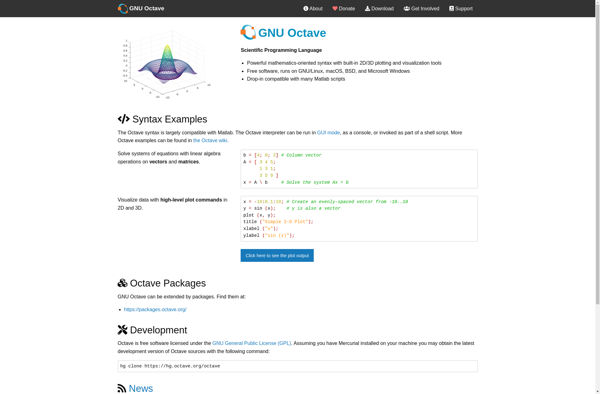
GNU Octave

GNU Octave is an open-source mathematical programming language and environment that is compatible with MATLAB. It allows users to perform numerical computations, data manipulation and visualization, and other mathematical tasks. Some key features of GNU Octave include:An extensive library of mathematical functions for linear algebra, differential equations, optimization, statistics, and...
GNU Octave image
SageMath icon

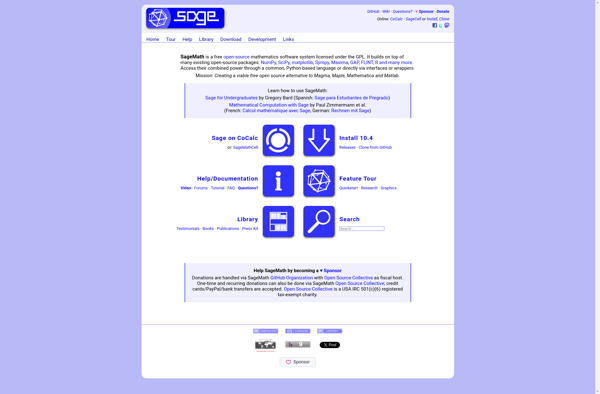
SageMath

SageMath is an open-source mathematics software system that provides a viable free open source alternative to Magma, Maple, Mathematica and MATLAB. It is based on Python and implements a huge range of mathematics functionality including:Algebra - including commutative algebra, group theory, combinatorics, graph theory, exact linear algebra, and moreCalculus -...
SageMath image
IPython icon

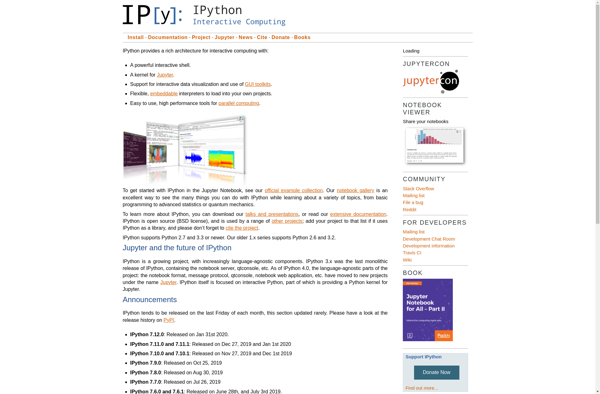
IPython

IPython is an interactive command shell and notebook environment for the Python programming language. It provides:An enhanced interactive Python shell with unique features for tab completion, object introspection, system shell access, command history retrieval across sessions, and more.An architecture that supports interactive parallel and distributed computing.A web-based notebook interface allowing...
IPython image
Spyder icon

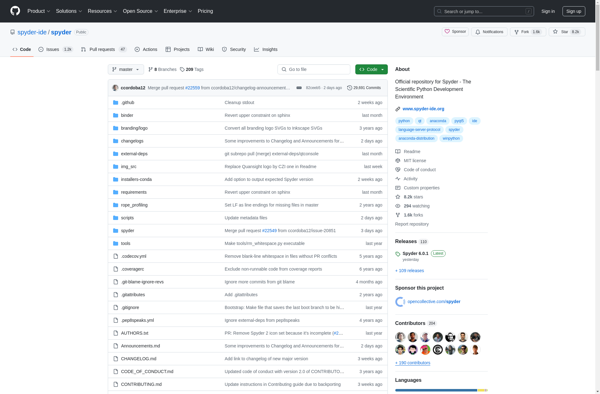
Spyder

Spyder is a powerful Python integrated development environment (IDE) with features tailored towards scientific computing and data analysis. It provides the following key capabilities:Advanced editor with syntax highlighting, code completion, variable explorer, and other features to facilitate Python coding.Interactive Python console for testing code snippets and exploring data.Data explorer for...
Spyder image