EQATEC Profiler
EQATEC Profiler is a software tool used to analyze, optimize, and profile .NET applications. It helps developers identify performance bottlenecks, memory issues, and other problems in their code.

EQATEC Profiler: Analyze, Optimize, Profile .NET Applications
EQATEC Profiler helps developers identify performance bottlenecks, memory issues, and other problems in their code.
What is EQATEC Profiler?
EQATEC Profiler is a comprehensive performance profiling and debugging tool for .NET applications. It allows developers to analyze their .NET code to identify performance bottlenecks, memory leaks, threading issues, and other problems.
Key features of EQATEC Profiler include:
- CPU and memory profiling to pinpoint slow functions and memory leaks
- In-depth call tree analysis to understand how functions interact
- ASP.NET profiling to optimize web apps and services
- Exception tracing to debug errors and crashes
- Code coverage to measure test completeness
- Powerful profiling reports to communicate optimization opportunities
EQATEC Profiler integrates into Visual Studio, Azure DevOps, and can profile both 32-bit and 64-bit .NET Framework and .NET Core applications. It is useful for developers looking to optimize the speed and stability of their .NET code.
EQATEC Profiler Features
Features
- Performance profiling
- Memory profiling
- Call graph analysis
- Thread analysis
- Code coverage
- Instrumentation-based profiling
- Support for .NET, .NET Core, and Mono applications
Pricing
- Freemium
- Subscription-Based
Pros
Comprehensive profiling capabilities
Detailed performance and memory analysis
Helps identify performance bottlenecks and optimize code
Easy to use and integrate into development workflow
Supports a wide range of .NET applications
Cons
Limited free version with restricted features
Paid version can be expensive for individual developers
Learning curve for complex profiling features
Limited support for non-Windows platforms
Official Links
Reviews & Ratings
Login to ReviewThe Best EQATEC Profiler Alternatives
View all EQATEC Profiler alternatives with detailed comparison →
Top Development and Performance Testing and other similar apps like EQATEC Profiler
Here are some alternatives to EQATEC Profiler:
Suggest an alternative ❐ANTS Performance Profiler
ANTS Performance Profiler is a comprehensive .NET profiling tool designed to help .NET developers diagnose performance issues and optimize their .NET applications. It allows profiling CPU usage, memory allocation, and database queries to identify code bottlenecks and memory leaks.Key features include:CPU profiling to find hot functions and code paths that...
AQtime Pro
AQtime Pro is a comprehensive performance profiling suite for identifying optimization opportunities in software applications. It supports profiling for .NET, C/C++, Java, and Delphi applications running on Windows, Linux, and macOS platforms.With AQtime Pro, developers can quickly analyze CPU and memory usage to understand where the application is spending time...

GlowCode
GlowCode is a feature-rich code editor and project management platform designed specifically for software developers. It includes capabilities like:Intelligent code completion based on machine learning to speed up codingPowerful debugger to identify and fix bugs fasterBuilt-in support for version control systems like Git and SVNTeam collaboration tools including code reviews...

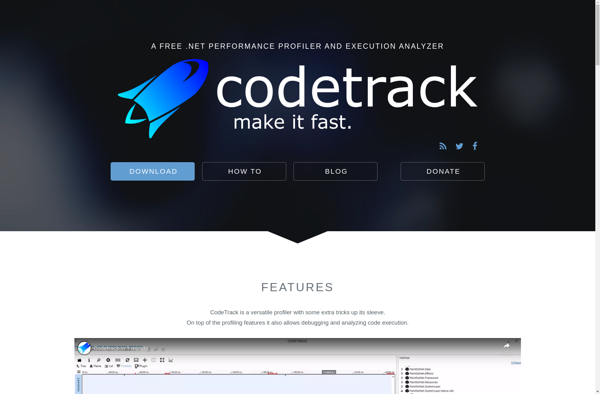
CodeTrack
CodeTrack is an issue and project tracking software designed specifically for software development teams. It provides a centralized platform to log bugs, tasks, feature requests, and other items that need to be tracked over the course of a project.With CodeTrack, development teams can create customizable workflows to match their process....
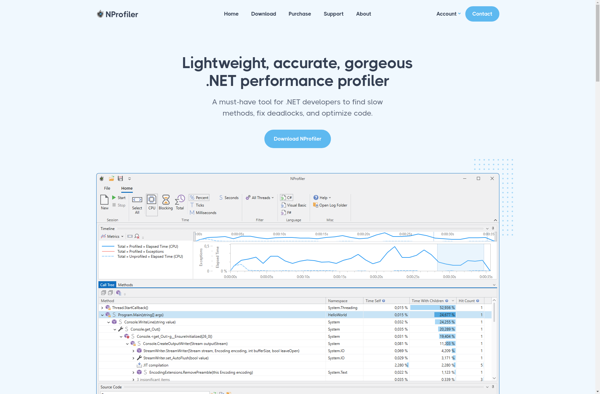
NProfiler
NProfiler is a performance profiling tool designed specifically for .NET applications running on Windows. It provides detailed insights into an application's memory usage, CPU utilization, execution times, and other key performance metrics.With NProfiler, developers can quickly identify memory leaks, garbage collection issues, excessive CPU usage, slow database calls, and other...
AMD CodeXL
AMD CodeXL is a comprehensive tool suite that enables developers to harness the benefits of AMD heterogeneous computing platforms. It provides insights into system performance and optimizations when software is targeting AMD CPUs, GPUs and APUs.The suite includes components such as debuggers, profilers, compilers, and analyzers that work in tandem...

SlimTune
SlimTune is a system optimization and tuning utility for Windows designed to help speed up, fix issues with, and improve the overall performance of your computer. It includes a variety of tools and features aimed at streamlining your PC:- Registry Cleaner: Cleans up invalid registry entries and fixes issues to...
