Lekh Diagram is an open-source, cross-platform diagramming and vector graphics application. It allows users to create flowcharts, network diagrams, organization charts, mind maps, and more. Key features include a simple and intuitive interface, support for multiple page sizes, cu
Create flowcharts, network diagrams, organization charts, mind maps, and more with Lekh Diagram, a cross-platform diagramming application featuring a simple interface, customizable templates, and file export options.
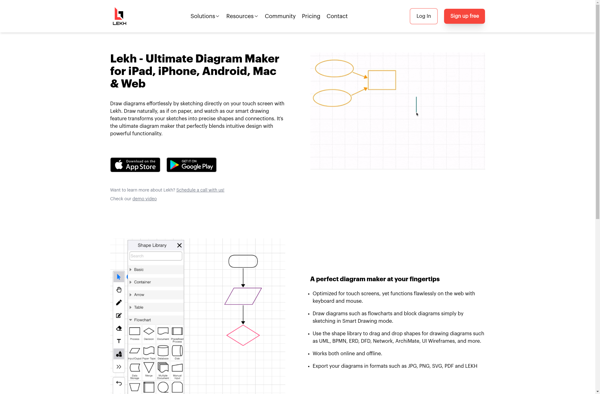
What is Lekh Diagram?
Lekh Diagram is an open-source diagramming and vector graphics editor that runs on Windows, Mac, and Linux. It provides a simple, easy-to-use interface for creating all kinds of diagrams including flowcharts, UML diagrams, network diagrams, mind maps, org charts, floor plans, and more.
Some key features of Lekh Diagram:
Intuitive drag-and-drop interface makes it easy to get started quickly
Includes numerous premade diagram templates and shapes to speed up diagram design
Supports multiple page sizes and custom page setups for flexibility
Objects can be styled and formatted extensively with custom colors, line types, fill effects, etc.
Connect objects and create complex diagrams with a variety of connectors and tools
Auto-alignment guides, snap-to-grid, and other aids for precision diagramming
Grouping, layers, and tree view allows for logical structuring of complex diagrams
Import data from CSV files to generate diagrams automatically
Export to PNG, JPEG, PDF as well as editable formats like Lekh and SVG
With its ease of use plus extensive formatting and customization options, Lekh Diagram is a valuable free alternative to paid software like Microsoft Visio for both casual and professional diagram creation.
Lekh Diagram Features
Features
Simple and intuitive interface
Support for flowcharts, network diagrams, organization charts, mind maps and more
Multiple page sizes
Customizable templates
Export to PNG, JPG, SVG, PDF formats
Pricing
Open Source
Free
Pros
Free and open source
Cross-platform - works on Windows, Mac, Linux
Active development and community support
Lots of shapes and diagram types
Easy to use and learn
Cons
Limited compared to paid alternatives
Less templates and features than proprietary options
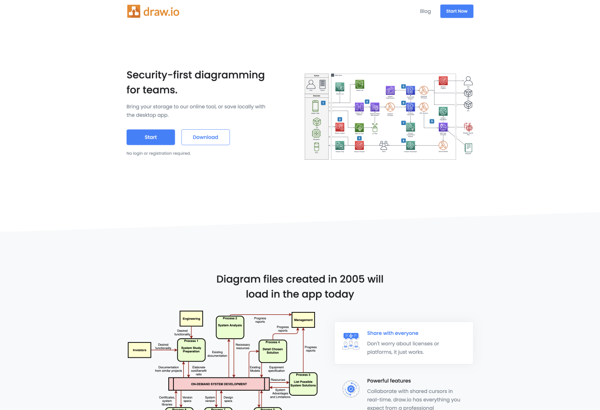
draw.io is a feature-rich diagramming and flowchart software that runs in your web browser. As a freemium tool, draw.io offers a free basic version as well as paid plans with more functionality for professionals and teams.With an intuitive drag-and-drop interface and built-in shape libraries, draw.io makes it easy for anyone...
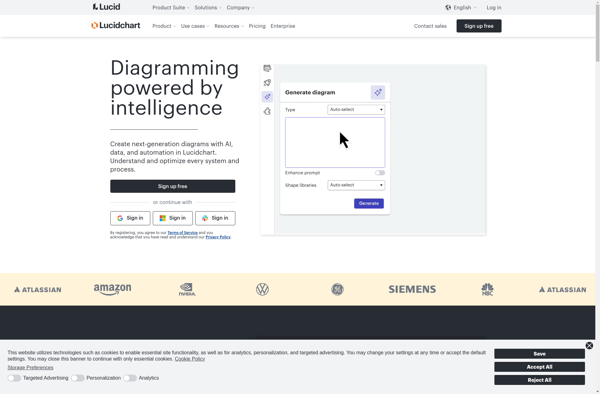
Lucidchart is a cloud-based diagramming application that allows users to collaborate and share diagrams in real time. It is used by over 30 million users and integrates with popular applications like Google Workspace, Microsoft Office 365, Confluence, and Jira.With an intuitive drag-and-drop interface, Lucidchart makes it easy for anyone to...
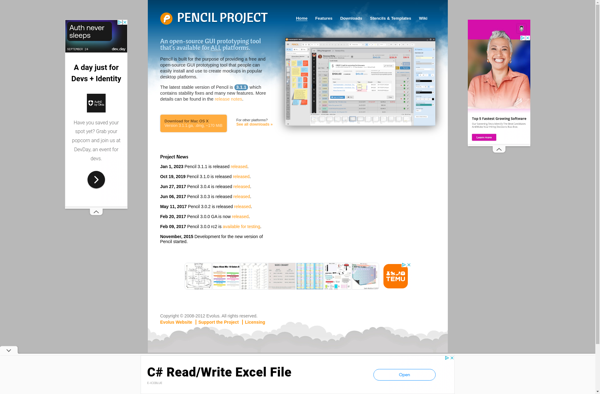
Pencil Project is a free and open source tool for creating GUI prototypes and mockups for applications and websites. It allows users to rapidly create wireframes and prototypes to visualize designs and layout concepts without any programming knowledge.Key features of Pencil Project include:An easy-to-use graphical interface for quick mockup generationTools...
Diagramo is an open-source diagramming and vector drawing software for Windows, Mac, and Linux operating systems. It provides an intuitive and user-friendly interface that allows users to easily create various types of diagrams including flowcharts, UML diagrams, network diagrams, organization charts, ER diagrams, mocks, prototypes, and more.Some key features of...
Dynamic Draw is a versatile and user-friendly vector graphics editor available for Windows, macOS, and Linux operating systems. As an open-source application, Dynamic Draw benefits from continual development and improvement from its active community of contributors.With an emphasis on usability and efficiency, Dynamic Draw makes it easy to create 2D...
ASCIIFlow is a free online text-based diagram drawing application that allows users to quickly create a variety of text ascii diagrams and charts. With its simple and intuitive interface, users can easily draw flowcharts, network diagrams, organizational charts, UML diagrams, sitemaps, wireframes and more using standard keyboard characters and symbols.Some...
ClickCharts is a business intelligence and data visualization software used to create dashboards, charts, and graphs to gain meaningful insights from data. Some key features of ClickCharts include:Drag and drop interface to easily build interactive visualizations like charts, graphs, gauges, maps, and moreLarge library of chart types including bar, pie,...
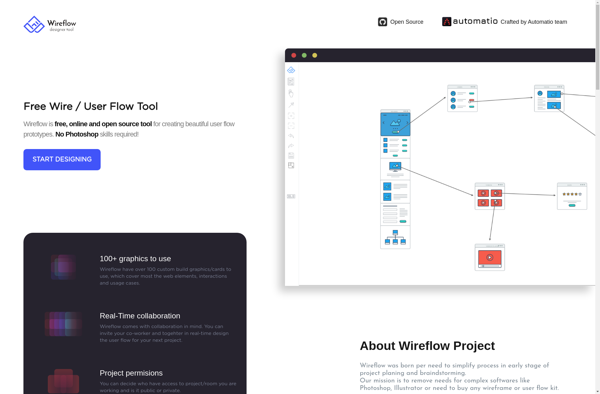
Wireflow is a web-based wireframing and mockup tool used to create prototypes and specs for website and app designs. It provides an intuitive drag and drop editor that allows designers and developers to quickly layout pages and interfaces before development begins.With Wireflow, you can easily add common UI elements like...