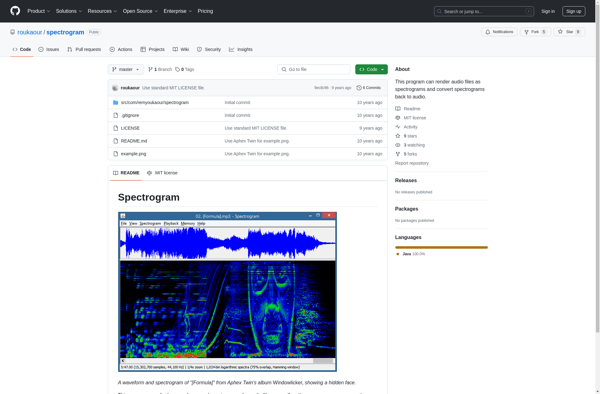
Spectrogram
Spectrogram: Analyze Acoustic Properties
A visual representation of frequency spectrum as it varies with time, used to analyze acoustic features of audio.
What is Spectrogram?
A spectrogram is a visual representation of the spectrum of frequencies of a signal as it varies with time. It is a useful tool for analyzing acoustic signals such as audio recordings.
In a spectrogram, the x-axis represents time, the y-axis represents frequency, and the color or intensity represents the amplitude or power of each frequency at that point in time. This creates a two-dimensional image with color mapping that shows how the spectral content changes over time.
Spectrograms allow us to visualize patterns, harmonics, transitions and other acoustic qualities that are not as discernible by simply listening to the audio. They are used extensively in fields like audio engineering, acoustics, phonetics, speech analysis and more to study the frequency and pitch content of sounds.
There are various types of spectrograms possible depending on the parameters used such as window sizes and overlap. Digital audio editors and analysis software like Audacity provide tools to easily generate and study spectrograms. They require signal processing analysis to convert from the time domain waveform into the visual frequency domain.
Spectrogram Features
Features
- Visualize the frequency spectrum of audio signals over time
- Adjust parameters like window size, overlap, and color scheme
- Perform basic audio processing tasks like filtering and normalization
- Export spectrograms as image files for further analysis or reporting
- Support for various audio file formats including WAV, MP3, and FLAC
Pricing
- Free
- Freemium
- One-time Purchase
- Subscription-Based
Pros
Cons
Official Links
Reviews & Ratings
Login to ReviewThe Best Spectrogram Alternatives
View all spectrogram alternatives with detailed comparison →
Top Audio & Music and Audio Analysis and other similar apps like Spectrogram
Here are some alternatives to Spectrogram:
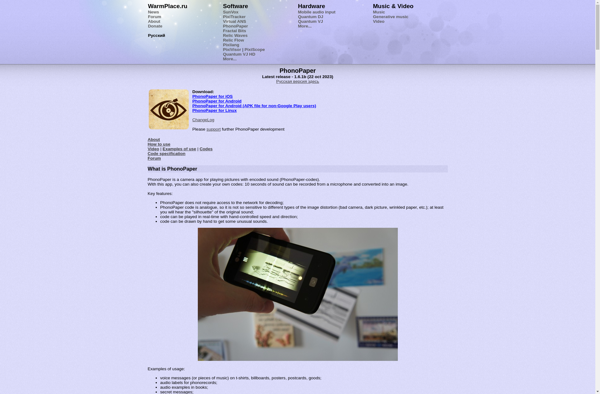
Suggest an alternative ❐PhonoPaper
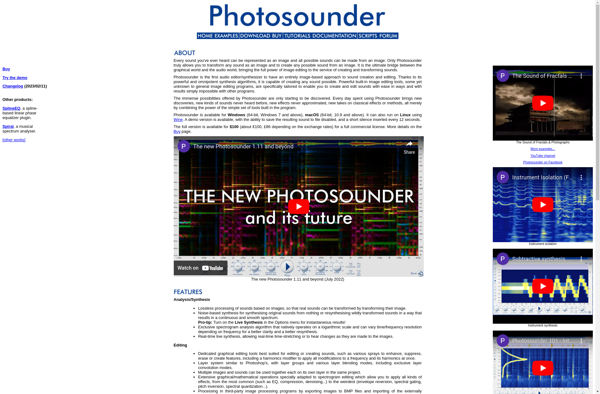
Photosounder
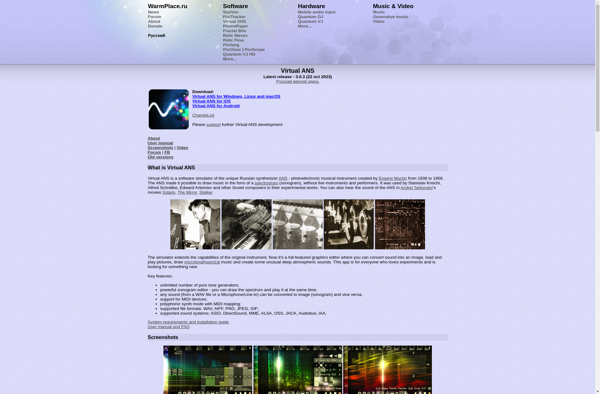
Virtual ANS