Sprinkle Data
Sprinkle Data: Business Intelligence and Data Visualization Software
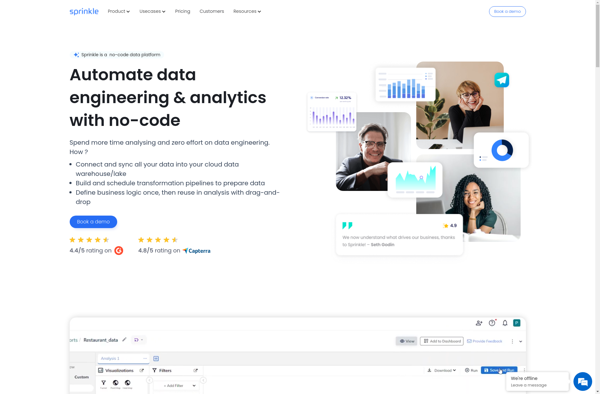
A user-friendly business intelligence and data visualization software to create reports, charts, and dashboards without coding, with a powerful drag-and-drop interface.
What is Sprinkle Data?
Sprinkle Data is a business intelligence and data visualization software designed for non-technical business users to explore, visualize and share data insights. It delivers easy self-service BI with an intuitive drag-and-drop interface so that anyone in an organization can produce dashboards and reports to track KPIs without needing developer resources.
Key capabilities and benefits include:
- Intuitive drag-and-drop interface for self-service data analysis and visualization without needing to code
- Hundreds of customizable data connectors to easily connect to data sources like MySQL, PostgreSQL, Salesforce and more
- Role-based access controls to securely share reports and dashboards with specific people or teams
- Wide range of interactive charts including tables, bar, pie, line, area, scatter and more for data discovery
- Powerful dashboard designer to build visually engaging reports to track metrics and KPIs
- Scheduled report distribution to automatically send reports to stakeholders on a recurring schedule
- Mobile optimization providing touch-enabled dashboards for data analysis on the go
- On-premise or cloud deployment options suiting security and infrastructure needs
Overall, Sprinkle Data enables organizations to democratize access to company data and empower business professionals with self-service analytics capabilities to make data driven decisions. Its intuitive interface allows faster time-to-insight without bogging down IT resources.
Sprinkle Data Features
Features
- Drag-and-drop interface
- Pre-built templates
- Customizable dashboards
- Interactive visualizations
- Collaboration tools
- Automated reporting
- Data connectors
- Mobile optimization
Pricing
- Subscription-Based
Pros
Cons
Official Links
Reviews & Ratings
Login to ReviewThe Best Sprinkle Data Alternatives
View all Sprinkle Data alternatives with detailed comparison →
Top Business & Commerce and Business Intelligence & Analytics and other similar apps like Sprinkle Data
Here are some alternatives to Sprinkle Data:
Suggest an alternative ❐Talend
Hevo Data
Xplenty
Astera Centerprise