Telegraf is an open-source server agent that collects, processes, aggregates, and writes metrics. It can collect metrics from a wide range of input plugins including statsd, Elasticsearch, MySQL, and more. Telegraf is useful for monitoring systems and applications.
Telegraf: Open-Source Server Agent for Metrics Collection
Collects, processes, aggregates, and writes metrics from various input plugins including statsd, Elasticsearch, MySQL, and more, useful for monitoring systems and applications.
What is Telegraf?
Telegraf is an open source server agent written in Go for collecting, processing, aggregating, and writing metrics. Telegraf can be used to collect and report on metrics, events, and logs from databases, systems, and IoT devices. It also has an extensive library of plugins enabling it to collect metrics from a wide range of data inputs including:
StatsD and StatsD compatible endpoints
Elasticsearch
MySQL
PostgreSQL
MongoDB
Redis
Webservers like Nginx
System metrics like disk usage, CPU usage, memory usage, etc.
IoT devices and sensor data
Key capabilities and uses of Telegraf include:
Monitoring infrastructure and application performance
Aggregating metrics from various sources and standardizing formats
Sending metrics to databases like InfluxDB and time series databases
Integrating with data visualization and monitoring tools like Grafana
Building full observability pipelines when combined with other tools like InfluxDB and Grafana
As a plugin-driven agent written in Go, Telegraf is highly extensible, lightweight, and ideal for large scale metric collection and processing.
Telegraf Features
Features
Plugin-driven data collection
Built-in plugins for common data sources like CPU, memory, disk, network, etc
Flexible output plugin system allows sending data to a variety of destinations
Aggregation of metrics for performance optimization
Data collection interval can be customized
Highly extensible and customizable
Pricing
Open Source
Pros
Open source and free
Large plugin ecosystem
Easy to get up and running
Lightweight and efficient
Great community support
Cons
Can be complex to configure for advanced use cases
Not as feature rich as some commercial alternatives
Limited native visualization and dashboarding capabilities
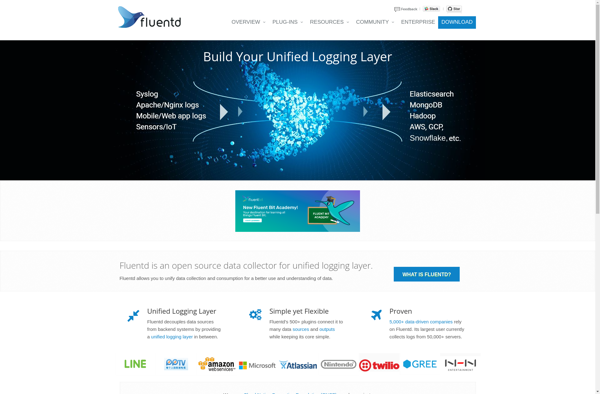
Fluentd is an open source data collector designed for processing data streams. It works by having input plugins that collect data from various sources, processing plugins that transform the data, and output plugins that send the data to various destinations.Some key features of Fluentd include:Unified logging layer - It allows...
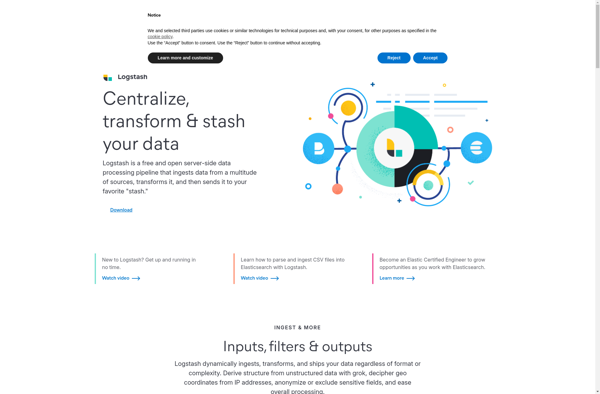
Logstash is an open source, server-side data processing pipeline that ingests data from a multitude of sources simultaneously, transforms it, and then sends it to your favorite "stash."It is typically used as part of the ELK stack (Elasticsearch, Logstash, Kibana) for logging use cases. Logstash ingest data from various input...
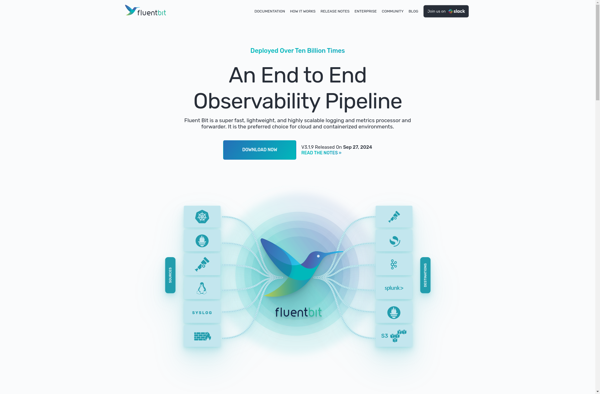
Fluent Bit is an open source log processor and forwarder designed to be lightweight, flexible and fast for collecting, parsing and routing logs from different sources. Some key features of Fluent Bit include:Lightweight with no external dependencies, runs on Linux, macOS, Windows and embedded systems like Raspberry Pi.Real-time log processing...
Vector by Datadog is an open source observability data pipeline that ingests metrics, logs and traces to provide visibility into infrastructure and application performance. It is designed to address the challenge of collecting, transforming and routing high volumes of observability data from modern infrastructure.Some key capabilities and benefits of Vector...
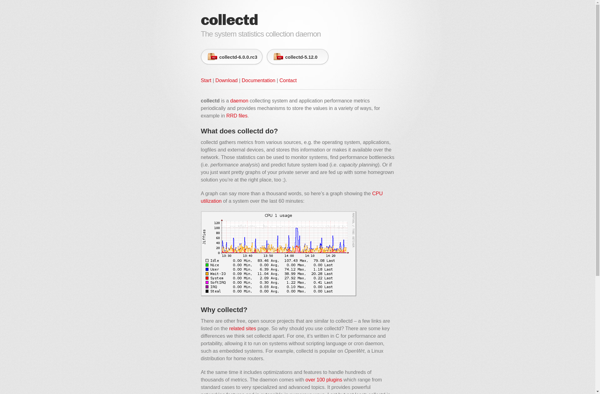
collectd is an open source daemon that collects system performance statistics periodically and provides methods to store the values in a variety of ways. It supports collecting data from a broad range of subsystems like operating system metrics, logging daemons, network load and more.Some key features of collectd include:Written in...
StatsD is a network daemon for statistics aggregation and metric tracking. It listens for metrics over UDP or TCP, aggregates the metrics in memory, and periodically flushes them to a backend service like Graphite or InfluxDB.Some key features of StatsD:Metrics aggregation - StatsD aggregates similar metrics to reduce load on...
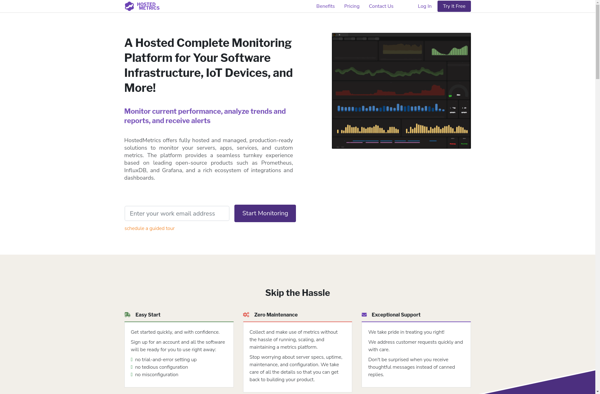
HostedMetrics is a user-friendly web analytics platform designed for businesses who want powerful yet intuitive analytics. As a hosted solution, there is no software to install or servers to maintain. HostedMetrics seamlessly integrates with your website to track every visitor interaction, then transforms that raw data into beautifully visualized reports...
Snap Telemetry is an open-source telemetry framework designed for collecting metrics and data from systems and applications to give observability into their performance and health. It is developed by Snap Inc as part of their open-source initiatives.Some key capabilities and features of Snap Telemetry include:Supports ingesting metrics, events, logs and...